
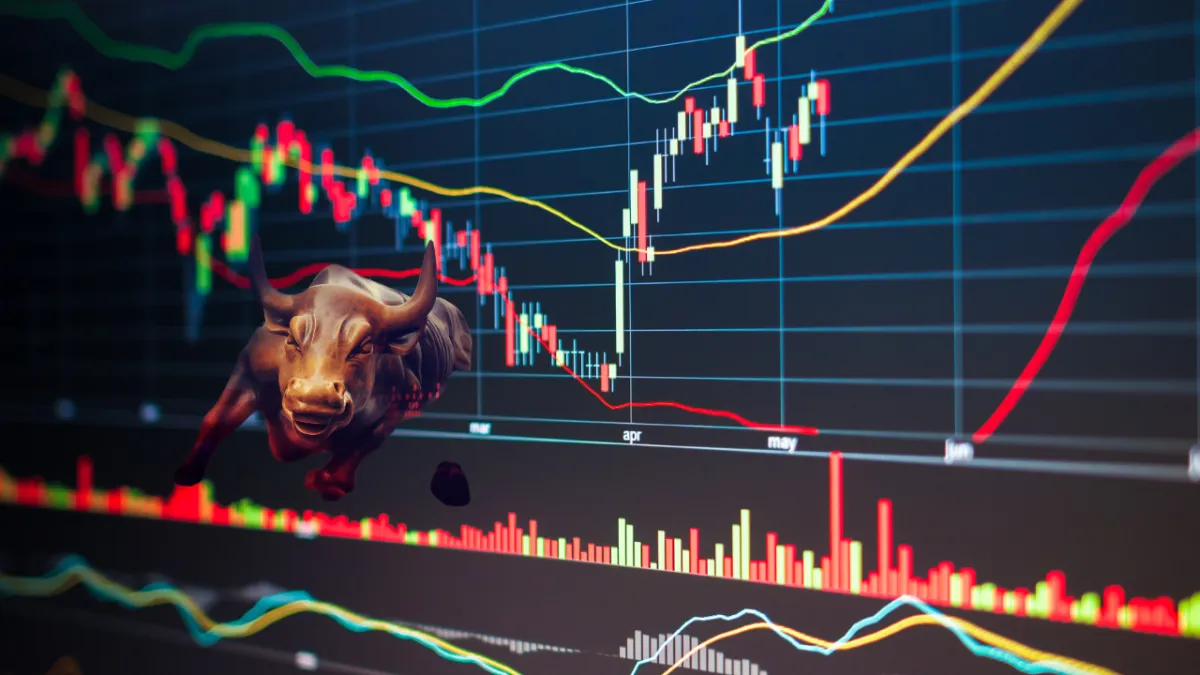
Welcome to Real Life Trading
Achieve Financial Freedom Through
Expert Stock Market Education
At Real Life Trading, we know that trading isn’t just about making money—it’s about creating freedom, security, and opportunities for a better future for you and your family.
Our mission is to enrich lives by teaching the skills needed to trade the stock market profitably and safely—whether you're looking for side income, financial independence, or advanced strategies for consistency.
We’re the highest-rated stock market education company because we focus on real, proven skills—not empty promises.
Join us and take control of your financial future today!
AS FEATURED IN


Start Your Journey To Financial Freedom Today!
Choose Your Trading Journey Path
Select the option that best fits your journey and let us guide you toward your success!
New to Trading
Experienced Trader Looking for Consistency
Advanced Trader Ready to Level Up
New to Trading? We've Got You!
Getting Started Can Feel Overwhelming.
With so many options out there, it’s hard to know where to begin.
The good news? You don’t have to navigate this journey by yourself.
You might be thinking:
"Where do I even begin?"
"What if I make a mistake and lose everything?"
"This is way too complicated!"
"I'm not great with math."
"What if I make a mistake and lose everything?"
"How do I find the time to learn this?"
"Do I need a lot of money to get started?"
"I have a job, can I still learn to trade?"
We understand. We were once where you are now. Every successful trader started with these same fears. The good news? Trading doesn’t have to be scary or complicated. You can learn to trade while you have a job. You don’t need a finance degree, a huge starting balance, or endless hours of free time to learn how to trade. With the right guidance and a simple, step-by-step approach, YOU CAN DO THIS! We’re here to guide you step-by-step, making trading simple, safe, approachable and stress-free.
Already Have Trading Experience?
You’ve put in the time. You’ve studied the charts. But… something’s not clicking.
Sound familiar?
One week you’re profitable, the next you’re giving it all back.
You’ve tried different strategies, but none seem to work consistently.
Overtrading, hesitation, or FOMO are road blocks to your progress.
Struggling to control emotions like fear and greed, leading to impulsive decisions.
Market changes throw you off, and you struggle to adapt.
Risk management? You know it’s important, but execution is another story.
Feeling isolated without a supportive trading community
We’ll help you refine your approach, identify what’s holding you back, and create a clear, actionable plan to achieve consistent success.
What’s Holding You Back?
Let’s Fix It.
At Real Life Trading, we help traders like you:
Fine-tune your strategy for consistent results (no more guesswork)
Eliminate emotional trading and master your mindset to build unshakable discipline
Spot high-probability setups and stop chasing bad trades
Adapt to market conditions with confidence, no matter what’s happening
Join a thriving trading community so you never have to trade alone
You’ve already started the journey. Now, let’s get you to the finish line.
Ready to take your trading to the next level?
Start Your Journey To Financial Freedom Today!
Choose Your Trading Journey Path
Select the option that best fits your journey and let us guide you toward your success!
New to Trading
Experienced Trader Looking for Consistency
Advanced Trader Ready to Level Up
At Real Life Trading, we understand the challenges you’re facing, whether you’re just starting out or trying to break through to consistent profitability.

Here’s how we help you overcome those hurdles and achieve success
For New Traders: Building Confidence and Clarity
Start Strong: Gain Confidence, Clarity, and Control in Your Trading Journey!

Step-by-Step Guidance
Our FREE beginner-friendly courses simplify trading, breaking it down into manageable steps so you’ll know exactly where to start.
Free Weekly Live Coaching
Get direct access to professional traders who answer your questions in real-time and help you navigate the learning process.
Practical Tools
Learn to trade without needing advanced math or expensive tools. We’ll teach you strategies that are simple, effective, and accessible.
Risk Management Basics
Discover how to trade safely with strategies designed to minimize potential losses while building your confidence and learning the R system.

For Experienced Traders: Fixing Inconsistencies and Strategies
Refine Your Skills: Break Through Barriers and Achieve Consistent Success!
Refined Trading Strategies
Our proven methods help you identify what’s working, eliminate what isn’t, and develop a plan tailored to your goals.
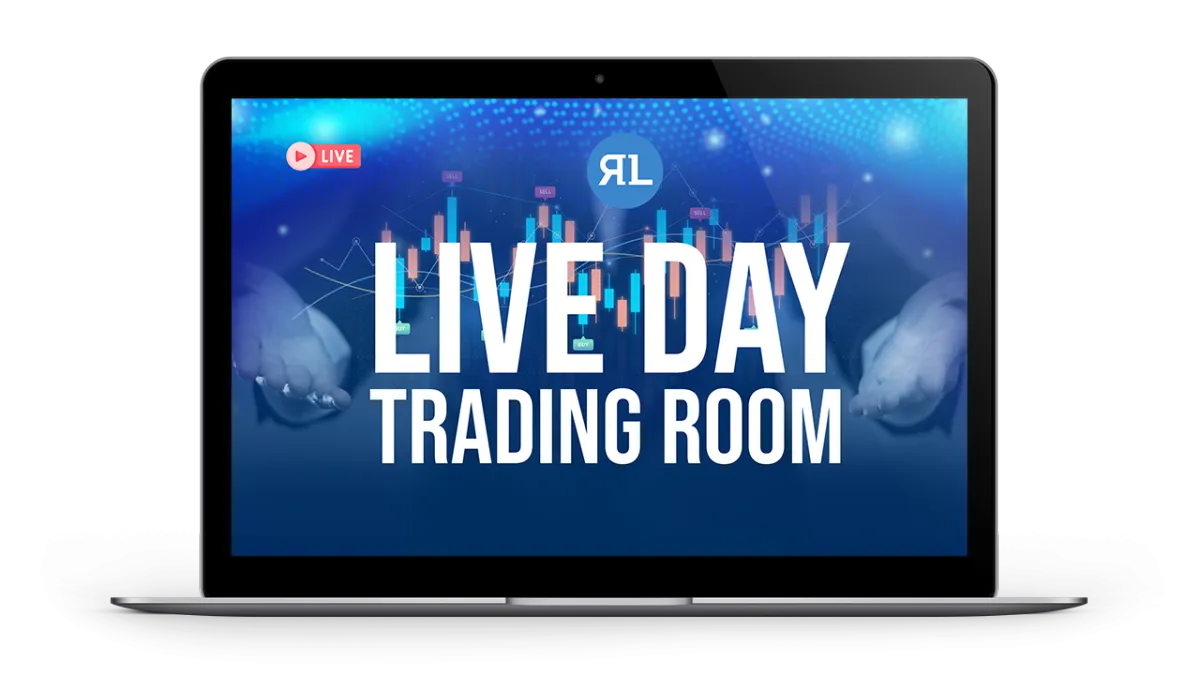
Live Trading Rooms
Watch professionals trade live during market hours and ask questions. See their strategies in action, learn how to control emotions, and gain insights into real-time decision-making.
Community Support
Join a network of like-minded traders in our private Slack group. Share ideas, get feedback, and stay motivated with the help of others who’ve faced and solved similar problems.
Free Courses Designed for Your Consistent Trading Success
Master the essentials of trading with our comprehensive courses covering price action, proven strategies, and emotional control. Learn how to read the markets with precision, apply winning tactics, and stay calm under pressure—equipping you with the tools to trade confidently and consistently.
Live Trading & Coaching Calendar
Live trading rooms
Step Into the Minds of Professional Traders
Experience trading like never before by watching the live screen of a full-time professional trader in action.
Navigate the Markets with Confidence
See how the pros analyze market trends, spot opportunities, and make decisions in real-time.
Master Proven Strategies
Watch as strategies are applied step-by-step, demystifying the process and showing you exactly how to execute them successfully.
Control Your Emotions Under Pressure
Learn how experienced traders handle the ups and downs of the market with poise, and gain the mental discipline to do the same.
COMMUNITY
Why a Trading Community is Essential for Traders of ALL Experience Levels
Starting your trading journey can feel overwhelming, especially when fear of making mistakes holds you back.

How a Trading Community is a
GAME CHANGER
Eliminates Isolation
You don’t have to trade alone. A community connects you with like-minded individuals who are on the same journey, so you feel supported every step of the way.
Answers Your Questions
When you’re unsure about strategies, tools, or trades, you can ask experienced traders and get clear, actionable answers instantly.
Builds Confidence
Seeing others succeed—and learning how they overcame the same challenges you’re facing—boosts your belief that you can do it too.
Guides You Through the Fear
Whether it’s fear of losing money or fear of starting, the community helps you take small, confident steps to trade safely and effectively.
Accelerates Learning
Learn from the collective knowledge of the group. Mistakes you might make on your own can be avoided by tapping into the insights of others.
Choose Your Trading Journey Path
Select the option that best fits your journey and let us guide you toward your success!
New to Trading
Experienced Trader Looking for Consistency
Advanced Trader Ready to Level Up
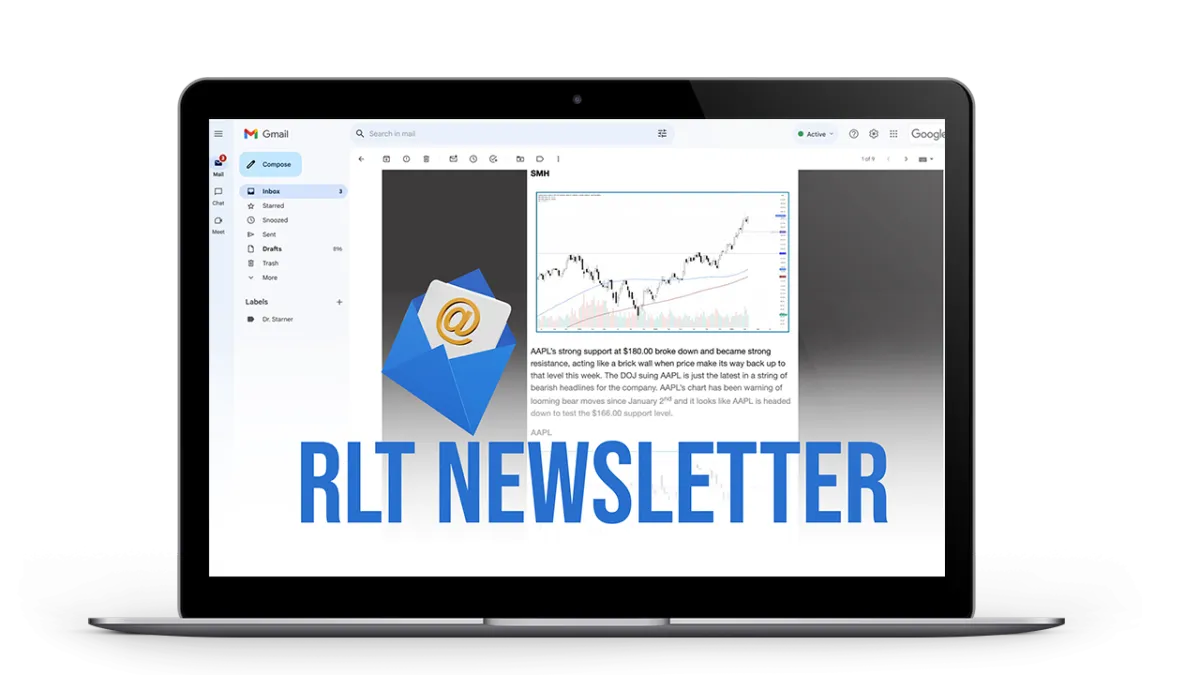
GET TRADE ALERTS
At the RLT Newsletter, our mission is simple: to educate and empower ordinary people to take control of their financial futures and confidently manage their investments.
Whether you're a beginner or a seasoned investor, our expert market analysis and proven, rules-based trading systems are designed to help you grow your wealth effectively—while giving you more time to focus on what truly matters in your life. It’s time to overcome the challenges holding you back, face the market head-on, and come out victorious. The stock market is the greatest wealth creation tool ever known, and it’s your time to start actively participating in it. Let us help you thrive—click below to learn more and subscribe to The RLT Newsletter!
Just $59/Month
Join Now
MONEY MAKING BLOGS

Maket Milestones: Reversal?
We’ve been talking for a while now about the similarities between the July 2023 and July 2024 price action and our current bull run. Last week, I wrote about SPY’s tendency to show bearish RSI divergence before every major top in recent years. That divergence had been showing up clearly on QQQ, but not on SPY—until now. SPY's RSI had previously pushed up to 75.54, which is historically an area where we see some form of retracement.
This week’s price action once again gave us the divergence I was looking for on SPY making it very similar to the July 2024 divergence at the top. However, RSI divergence alone doesn’t prove a top is here. Just look back at 2023—we saw divergence for months before any meaningful pullback materialized and we already had divergence between the May and June highs on the SPY and have only gone higher since.
What I like to see at tops is a reversal candle or bearish gap to confirm the move. On Thursday, we got that: a bearish engulfing reversal candle. The day opened at new all-time highs, pushing into our major trendline and just above the three bearish candles that started the week. Generally, a gap just above 3 bearish candles and some sideways consolidation is a very bullish thing, however this market feels tired. So instead of continuing higher on the bullish gap, it dropped hard, closing below five days of price action and right at the low of our rising wedge support. If this is going to actually signal a top, we need to break the trendline support and then close strongly below the horizontal support at $618. If it does either one of those on a bearish gap, that’s even better. If that happens, I will be fully in the camp of preparing to buy the dip at a discount in order to ride it to new all-time highs and beyond in 2025 and 2026.
Let’s not forget—Jerremy Newsome went fully to cash this week. So, if this is the top, then technically Jerremy has now called the top and bottom of this move. He likes to say you don’t need to call tops and bottoms in the market to make money, but apparently, he still likes to.
SPY

Topping Signals as I See Them Right Now:
SPY is at the top of the channel it’s been trading in since 2022.
Daily RSI is at 75, which is a historical reversal level.
Bearish divergence on both SPY and QQQ.
Bearish engulfing candles on both indices.
RSP (equal weight S&P 500), IWM, and DIA are all lagging SPY and also showing bearish divergence.
SMH made a new high this week—but on lower volume and with month-long bearish divergence.
DXY has formed a solid double bottom and is pushing higher—generally a headwind for equities and crypto.
Key AI names like NVDA, TSM, and AVGO are making new highs on divergence after 100%+ runs in just a few months.
VIX is back to 14—right where it was before the February top.
And, again, Jerremy is fully in cash.
That’s a whole lot of reasons to be cautious right now.
SMH

How Much Dip is Too Much Dip?
The dip—which has taken longer to show up than I’d like—may finally be around the corner. It’s been about as elusive since April as Bigfoot, but the signs are adding up right now.
I still believe this will be a buyable dip, not a market crash. For a true breakdown, we’d need a black swan event—and that’s not something you can predict. You just manage risk and adapt as best you can if one shows up. Here is what I’m watching for in a pullback in August and September:
Slight Drop – A 5–6% pullback into the June 24th gap and strong support around $600. This would be a healthy dip that resets some indicators without breaking the overall uptrend.
Goldilocks Zone – A 9–10% drop into the $580–$570 support area, where the daily long-term moving averages converge with the May 12th breakaway gap. This would be the ideal dip in terms of risk/reward, offering strong technical support and room to reload for another leg higher.
Deep Dip – A 13%-15% drop and more sustained correction down to the start of our rising wedge, with key support around $555, and potentially even the 100-week SMA. While I don’t think this scenario is highly probable given the current market strength, it’s worth noting. This would only be a 50% retracement of the rally from the April lows, so is still completely possible.
Black Swan – A close below the 100-week SMA. This is no longer just a dip—this would qualify as a crash. In that case, the weekly 200-day SMA comes into play, and we’d be looking at two 20%+ corrections in the same year, which would be a historic occurrence.
Realistically, I’m planning for scenario 1 and 2, as I believe those are the most probable outcomes.
SPY Channel

Could We Skip the Dip and Melt Up to $700 on SPY?
Yes—there’s still a chance the market powers higher, driven by AI momentum and continued inflows. In that scenario, maybe we see another breakaway gap on NVDA that launches it toward a $5–$6 trillion valuation this year. That valuation is likely coming in the next few years anyway—I just think a healthy correction for NVDA and most names is more probable, given how far we've already run.
For this melt-up without a correction to play out, we’d likely need to see the DXY drop again and break new lows, while TLT either grinds sideways or starts climbing. If that happens—and we get some consolidation in time instead of price—I could get behind this scenario, even if I’d rather see a cleaner reset first.
As it stands, I’m still leaning heavily toward a dip to the $600–$587 range on SPY in the next month or two. That dip should bring some excellent buying opportunities—and we’ll be ready for them in the RLT Newsletter.

Maket Milestones: Reversal?
We’ve been talking for a while now about the similarities between the July 2023 and July 2024 price action and our current bull run. Last week, I wrote about SPY’s tendency to show bearish RSI divergence before every major top in recent years. That divergence had been showing up clearly on QQQ, but not on SPY—until now. SPY's RSI had previously pushed up to 75.54, which is historically an area where we see some form of retracement.
This week’s price action once again gave us the divergence I was looking for on SPY making it very similar to the July 2024 divergence at the top. However, RSI divergence alone doesn’t prove a top is here. Just look back at 2023—we saw divergence for months before any meaningful pullback materialized and we already had divergence between the May and June highs on the SPY and have only gone higher since.
What I like to see at tops is a reversal candle or bearish gap to confirm the move. On Thursday, we got that: a bearish engulfing reversal candle. The day opened at new all-time highs, pushing into our major trendline and just above the three bearish candles that started the week. Generally, a gap just above 3 bearish candles and some sideways consolidation is a very bullish thing, however this market feels tired. So instead of continuing higher on the bullish gap, it dropped hard, closing below five days of price action and right at the low of our rising wedge support. If this is going to actually signal a top, we need to break the trendline support and then close strongly below the horizontal support at $618. If it does either one of those on a bearish gap, that’s even better. If that happens, I will be fully in the camp of preparing to buy the dip at a discount in order to ride it to new all-time highs and beyond in 2025 and 2026.
Let’s not forget—Jerremy Newsome went fully to cash this week. So, if this is the top, then technically Jerremy has now called the top and bottom of this move. He likes to say you don’t need to call tops and bottoms in the market to make money, but apparently, he still likes to.
SPY
Topping Signals as I See Them Right Now:
SPY is at the top of the channel it’s been trading in since 2022.
Daily RSI is at 75, which is a historical reversal level.
Bearish divergence on both SPY and QQQ.
Bearish engulfing candles on both indices.
RSP (equal weight S&P 500), IWM, and DIA are all lagging SPY and also showing bearish divergence.
SMH made a new high this week—but on lower volume and with month-long bearish divergence.
DXY has formed a solid double bottom and is pushing higher—generally a headwind for equities and crypto.
Key AI names like NVDA, TSM, and AVGO are making new highs on divergence after 100%+ runs in just a few months.
VIX is back to 14—right where it was before the February top.
And, again, Jerremy is fully in cash.
That’s a whole lot of reasons to be cautious right now.
SMH
How Much Dip is Too Much Dip?
The dip—which has taken longer to show up than I’d like—may finally be around the corner. It’s been about as elusive since April as Bigfoot, but the signs are adding up right now.
I still believe this will be a buyable dip, not a market crash. For a true breakdown, we’d need a black swan event—and that’s not something you can predict. You just manage risk and adapt as best you can if one shows up. Here is what I’m watching for in a pullback in August and September:
Slight Drop – A 5–6% pullback into the June 24th gap and strong support around $600. This would be a healthy dip that resets some indicators without breaking the overall uptrend.
Goldilocks Zone – A 9–10% drop into the $580–$570 support area, where the daily long-term moving averages converge with the May 12th breakaway gap. This would be the ideal dip in terms of risk/reward, offering strong technical support and room to reload for another leg higher.
Deep Dip – A 13%-15% drop and more sustained correction down to the start of our rising wedge, with key support around $555, and potentially even the 100-week SMA. While I don’t think this scenario is highly probable given the current market strength, it’s worth noting. This would only be a 50% retracement of the rally from the April lows, so is still completely possible.
Black Swan – A close below the 100-week SMA. This is no longer just a dip—this would qualify as a crash. In that case, the weekly 200-day SMA comes into play, and we’d be looking at two 20%+ corrections in the same year, which would be a historic occurrence.
Realistically, I’m planning for scenario 1 and 2, as I believe those are the most probable outcomes.
SPY Channel
Could We Skip the Dip and Melt Up to $700 on SPY?
Yes—there’s still a chance the market powers higher, driven by AI momentum and continued inflows. In that scenario, maybe we see another breakaway gap on NVDA that launches it toward a $5–$6 trillion valuation this year. That valuation is likely coming in the next few years anyway—I just think a healthy correction for NVDA and most names is more probable, given how far we've already run.
For this melt-up without a correction to play out, we’d likely need to see the DXY drop again and break new lows, while TLT either grinds sideways or starts climbing. If that happens—and we get some consolidation in time instead of price—I could get behind this scenario, even if I’d rather see a cleaner reset first.
As it stands, I’m still leaning heavily toward a dip to the $600–$587 range on SPY in the next month or two. That dip should bring some excellent buying opportunities—and we’ll be ready for them in the RLT Newsletter.
ABOUT REAL LIFE TRADING
We are a stock trading education company. Our goal is to teach and empower people to create generational wealth to enrich their lives and communities.
ONLINE TRAINING LINKS
