
Take Control of Your Financial Future
And Build the Life You Have Always Dreamed Of

Welcome to the RLT Newsletter
Helping Everyday Traders Beat the Market with Practical, Realistic Strategies
At the RLT Newsletter, our mission is simple: to educate and empower ordinary people to take control of their financial futures and manage their investments with confidence. We strive to help regular individuals like you invest and protect their hard-earned money to build a better life for themselves and their families.
Whether you're a beginner or a seasoned investor, our rules-based systems and clear analysis are designed to help you grow your wealth effectively—while giving you more time to focus on what truly matters in your life.
Struggling with Time, Knowledge, or Consistency?

Do you view investing as something that takes too much time, costs too much money, or feels too overwhelming to tackle on your own?
Maybe you can’t find the time to create trading plans, run scans, or set up alerts.
Are consistency and discipline your biggest hurdles, making it hard to stick to and follow a plan?
If this resonates with you,
The RLT Newsletter is here to help.
Our expert market analysis and proven, rules-based trading systems empower you to approach the stock market with confidence, discipline, and clarity. It’s time to overcome the challenges holding you back, face the market head-on, and come out victorious. The stock market is the best wealth creation device known to man and it’s time for you to start actively participating in it. Let us help you thrive!

Join the RLT Newsletter today to take back your time and secure your financial future.
Your Success, Our Mission: Empowering You to Win in the Market
Let Us Help You Succeed
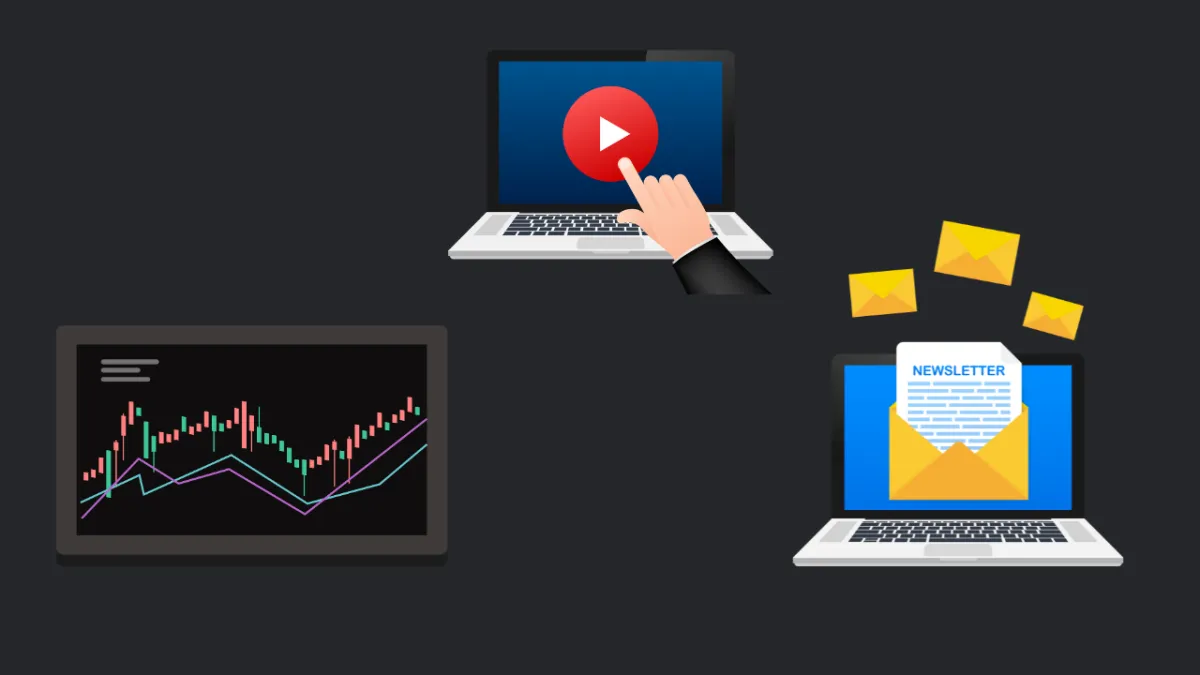
Stay Informed: Receive 4 emails per week with market news and key price updates.
Follow Proven Systems:
Gain access to 4 live trading portfolios, updated in real-time.
Save Time:
Make adjustments to your portfolio in just minutes each day.
Gain Confidence: Learn from clear, concise charts and expert analysis tailored for all skill levels.
Master the Market:
Dive deep into technical analysis with insights on gap dynamics, macro trends, Fibonacci retracements, and Elliott Wave theory.

At Real Life Trading, we understand the challenges you’re facing, whether you’re just starting out or trying to break through to consistent profitability.

WHAT'S INCLUDED WITH THE RLT NEWSLETTER:
4 live trading portfolios:
Long-term Swing Trading
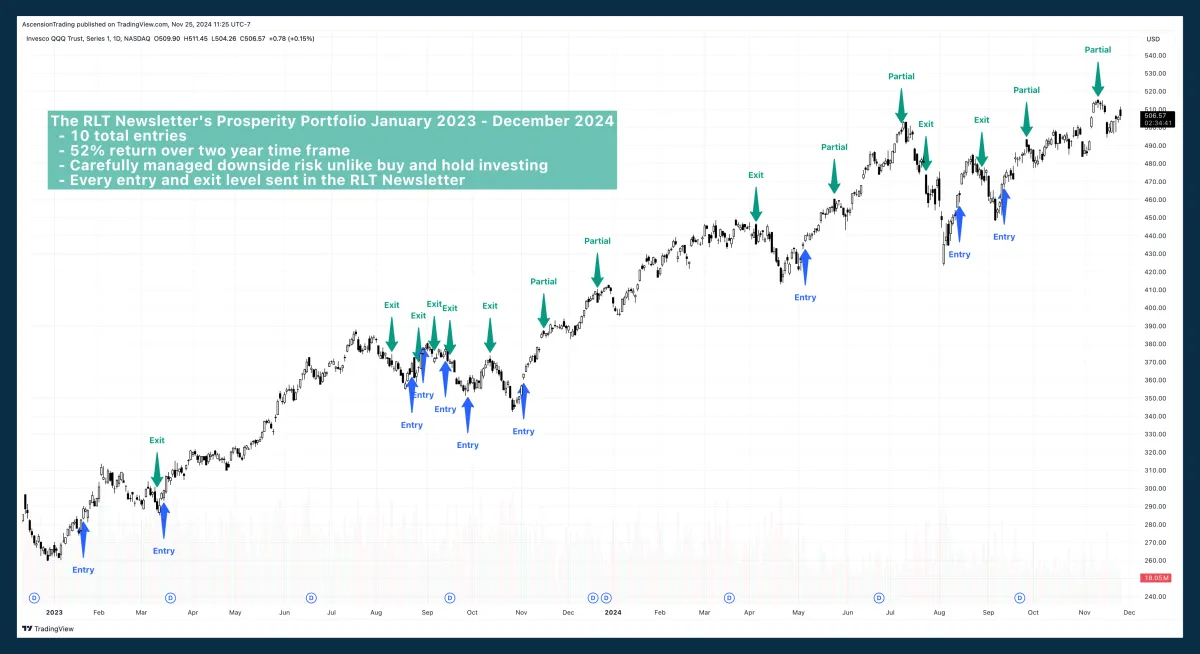
Long-term Investing
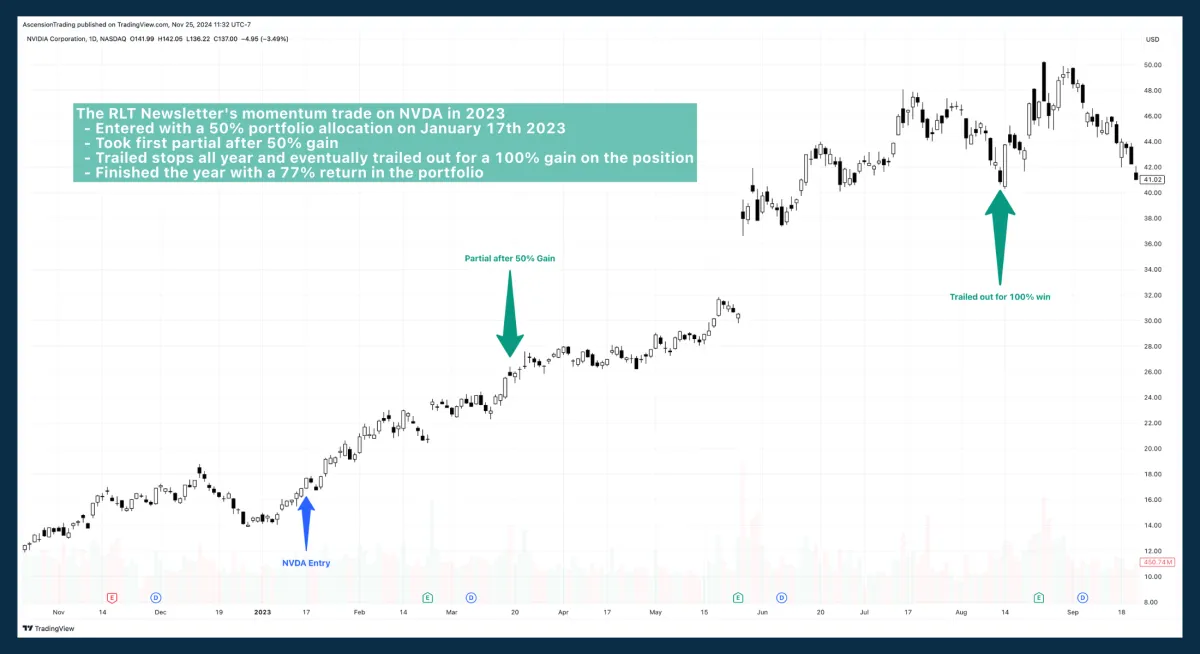
Momentum Trading
Short-term trading
4 weekly newsletters with trade alerts, stock picks, and market insights.
A weekly video featuring market rundowns and top stocks to watch.
On-demand support from an expert team of investors.
Portal access to track all actively managed portfolios.
Slack access to engage daily with our market analysts and the community.
Our Momentum Trading plan gets you exposure to the strongest stocks on the planet and helps you ride them higher for serious profits.

Our Prosperity Portfolio helps traders beat the market with just a few trades each year while managing downside risk. This slow and steady system is perfect for retirement accounts, long term trading accounts or anyone who wants amazing returns with very little time commitment.
Choose Excellence, Choose Results: Here’s Why We’re Your Best Bet
Our Promise to You

The Real Life Trading Newsletter stands apart from other financial publications by embracing a rules-based approach to the market and offering a genuine and realistic approach to the realities of trading. We recognize that trading entails both wins and losses, which is why we provide our members with straightforward, realistic expectations. Our commitment to transparency and authenticity combined with our sincere desire to empower our subscribers to reach their financial goals is what sets us apart. Join us as we take our trading skills and our trading accounts to the next level.
Don't Just Take Our Word For It...
Here's What Others Have To Say
Emails That Grow Your Wealth: How the RLT Newsletter Boosts Your Retirement Account and More
"Do you like "Mailbox Money"? What about great trade setups and ideas delivered straight to your email a few times a week? If your answer is yes, then you need to sign up for the RLT Newsletter. The YOLO MOMO and Prosperity Portfolio setups have been crushing the returns this year while managing risk. And every Tuesday, I get a video with some amazing chart analysis and trade ideas. My retirement account just keeps growing and it is all thanks to the RLT Newsletter!”
-Jason K.
From Confidence to Cash Flow: How the RLT Newsletter Transformed My Trading
"The RLT Newsletter is a great combination of technical analysis, trade ideas, and portfolio management. Both Yates and Jerremy are master technicians. I use the RLT Newsletter for short-term swing trade ideas and to practice my technical analysis. The Newsletter has increased my monthly cash flow, and it has given me the confidence to make my own trades based on the technical analysis provided. This Newsletter is an amazing value for the price. Highly recommended!”
-Chris W.
A Lifesaver for Busy Traders: How the RLT Newsletter Makes Every Hour Count
"I just can't stress enough how much I love your newsletters and how grateful I am for them. For a full time worker like myself that only has 1 hour a day to work on trading, it's a life saver! Thank you for all your time and effort putting them together!”
-Christopher W.
Finding the Perfect Fit: How the RLT Newsletter and Community Inspire Growth and Impact
"The RLT newsletter has been the right fit for me in the RLT community! I am hoping to continue to find ways to evolve, get more involved and use this education to change lives. Love your mission and the community of helpful people."
-Brian H.
Take the guesswork out of trading.
Gain the tools, insights, and support you need to succeed in the markets.
Just $59/Month
Frequently Asked Questions
How many emails will I receive each week?
You’ll receive 4 regular weekly emails on Monday, Tuesday, Thursday, and Friday. Additionally, you’ll receive occasional emails with portfolio updates as needed.
Can I cancel my monthly subscription anytime?
Yes! If you’re on the $59 monthly plan, you can cancel anytime, and your subscription will continue through the end of your current billing period.
Are the RLT Newsletter portfolios traded with live money?
No, all four RLT Newsletter portfolios are tracked in a simulated, paper trading account for educational and entertainment purposes only. Our goal is to teach traders how to manage risk and their own portfolios effectively. We are stock market educators, not financial advisors. If you need personalized financial advice, we strongly encourage you to consult a qualified financial professional.
Do the RLT Newsletter analysts take all the trades in the portfolios?
No, the analysts do not personally take every trade in the portfolios.
Are the stocks reviewed in the Tuesday Top Trade Video part of the 4 portfolios?
Not necessarily. While active or prospective trades for the portfolios may occasionally be discussed, the majority of the video focuses on general market reviews and stock charts that appear interesting from a technical analysis perspective.
What is the Prosperity Portfolio?
The Prosperity Portfolio is a long-term swing trading system that focuses exclusively on the QQQ. This long-only strategy aims to outperform the market by staying out during bearish periods and remaining invested during bullish trends. Unlike traditional buy-and-hold strategies, it actively manages downside risk, making it ideal for long-term investors seeking steady growth with reduced volatility. With only a handful of trades each year, it’s a time-efficient resource for those who want to grow their portfolio without the need for frequent trading.
What is the YOLO MOMO Portfolio?
YOLO, short for “you only live once,” paired with MOMO, short for “momentum,” defines the essence of the YOLO MOMO Portfolio. This momentum-driven, aggressive swing trading strategy focuses on capturing significant moves in the market’s strongest-performing tech stocks. With an emphasis on relative strength and excellent risk-reward setups, this system offers the potential for outsized returns. It comes with high volatility and large portfolio swings, making it an ideal resource for traders seeking aggressive growth and who are comfortable taking on higher levels of risk.
What is the RL Swing Stalker Portfolio?
The RL Swing Stalker Portfolio is a short-term swing trading system that leverages advanced market scans to uncover opportunities. Using the R system for precise risk management, this strategy takes both bullish and bearish trades to maximize profit potential. It’s an ideal resource for active traders looking for a system with well-defined risk parameters and frequent trading opportunities.
What is the HODL Hero’s Portfolio?
The HODL Hero’s Portfolio is a long-term investing strategy aimed at achieving substantial returns by holding high-quality stocks for extended periods. Risk is managed using advanced options strategies. This long-term portfolio does not use the R system for risk management, meaning it can experience larger drawdowns. This portfolio is a resource for long term investors focused on long-term growth and who are willing to embrace more volatility.
DISCLAIMER - PLEASE READ BEFORE MAKING ANY RLT NEWSLETTER TRADES
Disclaimer: Each portfolio in the RLT Newsletter is a hypothetical paper trading account. Real Life Trading and its analysts use these portfolios as an educational tool. It’s important to note that Real Life Trading nor its analysts are actively managing live, real-money portfolios. The analysts and moderators may or may not trade any of the given equities.
CFTC Rule 4.41: These results are based on hypothetical or simulated performance results with inherent limitations. Unlike actual performance records, these results do not represent real trading. Because these trades haven't been executed, the results may have under- or over-compensated for the impact of certain market factors, such as the lack of liquidity. Hypothetical or simulated trading programs are designed with the benefit of hindsight, and no representation is being made that any account will or is likely to achieve profits or losses similar to those shown.
Trading Risks: Real Life Trading LLC (“Company”) is not an investment advisory service, nor a registered investment advisor or broker-dealer and does not purport to tell or suggest which securities customers should buy or sell for themselves. The independent contractors, employees or affiliates of Company may hold positions in the stocks, options, currencies or industries discussed here. You understand and acknowledge that there is a very high degree of risk involved in trading securities, options and/or currencies. The Company assumes no responsibility or liability for your trading and investment results. It should not be assumed that the methods, techniques, or indicators presented will be profitable or that they will not result in losses. Past results of any individual trader or trading system presented by the Company are not indicative of future returns by that trader or system, and are not indicative of future returns which will be realized by you. In addition, the indicators, strategies, and all other features of Company’s products (collectively, the “Information”) are provided for informational and educational purposes only and should not be construed as investment advice.
MONEY MAKING BLOGS

Market Milestone: Grinding
After watching more price action come in this week, 2018 is shaping up to be the most likely analog we’re tracking. That said, it feels like SPY is headed to $700 before August. And mathematically, it’s possible—just 18 more days in a row like Thursday’s 0.75% gain to make it happen!
In this kind of relentlessly bullish environment, dips remain buyable, however large dips are starting to feel like myths—like Bigfoot or a trader who’s never taken a loss. When sentiment is this strong, trailing stop higher is a great way to stay in the trend without selling out too early.
Right now, $600 on SPY and $591.80 are the two key support levels I’m watching along with the pink trendline that is acting as support. As long as those hold, I’m expecting more "higher for longer." If we break below the trendline or either key support, that’s when I am expecting the actual retest to begin. Until then, it’s an “up only” summer.
SPY

In Thursday’s RLT Newsletter, I laid out the case for why QQQ looks like it's repeating the pattern we saw from December 2023 through March 2024. That pattern lasted 80 days until it peaked—right now, we’re only about 42 days into this new channel. If the setup plays out again, that means we are only halfway though, with a potential target around $570. As long as QQQ holds $523.50, the bull march higher is intact. A close below that level could mean a retest of $500 or lower.
In summary: long is strong. As long as we hold key supports, the trend is your friend. If you're looking for signs of a coming pullback, I’ve got a few. But if you’re looking for reasons why the market will keep going up forever, just research the projected rate of currency debasement over the next decade. Zoom out, extend your time horizon, and you'll see why "up and to the right" remains the long-term game—so long as the money printer stays plugged in.
QQQ

Signs We May Be Nearing a Short-Term Peak
Bearish Divergence on RSI
We now have three higher highs in price paired with three lower lows in RSI. This signals a slowdown in bullish momentum. It’s not inherently bearish, but it does suggest the bulls are losing some steam. We saw this same divergence back in 2018—it took 80 days before it finally broke down with an 8% correction.Falling Volume Since the May 12 Gap
As we’ve continued to grind higher, volume has declined. That, combined with weakening RSI, signals this move could be running out of juice.Breadth is Narrowing
Fewer and fewer stocks are participating in the rally. Fewer than 50% of names in the S&P 500 are above their 200-day moving averages, even as SPY pushes higher. This means the big names—MSFT, NVDA, AVGO, META, JPM—are doing all the heavy lifting.
This narrowing breadth usually resolves one of two ways
The laggards play catch-up, leading to broad market rotation higher.
Or the leaders finally pull back—and everyone drops together.
Which scenario you think is going to play out really depends on your 2–3 month outlook.
RSP Still Lagging
The equal-weighted S&P (RSP) isn’t making new all-time highs, and it’s showing bearish divergence on its recent moves. Yes, it’s now above its long-term daily moving averages—which is a win for the bulls—but it’s still trailing behind the cap-weighted index.
S5TH

What’s Next?
SPY looks set to break into new all-time highs on Friday, with a short-term target zone between $616 and $629 over the coming weeks. If we then see a breakdown below our key SPY and QQQ trendlines, get ready to buy the dip at the levels we’ve outlined:
SPY first key support: $575
QQQ first key support: $495
Until then, stay bullish, trail your stops, and keep your eyes on those key pivot levels.
Bitcoin Post Script
What would a Market Milestone be without a Bitcoin update? Incomplete—that’s what.
However, don’t expect me to write weekly updates on BTC during the depths of crypto winter. I’ll be far too busy garage sale-ing all my belongings to buy every last satoshi possible… and crying myself to sleep each night for not selling at the exact top so I could rebuy the exact bottom like an absolute legend.
Anyway, BTC isn’t making new all-time highs alongside the market just yet. It’s only about 4% off, so not a dramatic divergence, but still notable. It’s lagging a bit right now.
Currently, I have three main counts for Bitcoin:
Orange and Green counts: These both suggest further dips into the mid to low $90Ks. If that full correction plays out, it could develop into face-ripping bullish moves to close out the year.
Blue count: This count has BTC’s low in with it breaking out soon and heading toward Target 1. It’s the less bullish scenario, still solid—but by Bitcoin standards, a tepid end to the bull run.
Whichever way this resolves, BTC still looks poised to head higher in 2025. If we dip first, I’ll be a buyer in the green box.
BTC


Market Milestone: Grinding
After watching more price action come in this week, 2018 is shaping up to be the most likely analog we’re tracking. That said, it feels like SPY is headed to $700 before August. And mathematically, it’s possible—just 18 more days in a row like Thursday’s 0.75% gain to make it happen!
In this kind of relentlessly bullish environment, dips remain buyable, however large dips are starting to feel like myths—like Bigfoot or a trader who’s never taken a loss. When sentiment is this strong, trailing stop higher is a great way to stay in the trend without selling out too early.
Right now, $600 on SPY and $591.80 are the two key support levels I’m watching along with the pink trendline that is acting as support. As long as those hold, I’m expecting more "higher for longer." If we break below the trendline or either key support, that’s when I am expecting the actual retest to begin. Until then, it’s an “up only” summer.
SPY
In Thursday’s RLT Newsletter, I laid out the case for why QQQ looks like it's repeating the pattern we saw from December 2023 through March 2024. That pattern lasted 80 days until it peaked—right now, we’re only about 42 days into this new channel. If the setup plays out again, that means we are only halfway though, with a potential target around $570. As long as QQQ holds $523.50, the bull march higher is intact. A close below that level could mean a retest of $500 or lower.
In summary: long is strong. As long as we hold key supports, the trend is your friend. If you're looking for signs of a coming pullback, I’ve got a few. But if you’re looking for reasons why the market will keep going up forever, just research the projected rate of currency debasement over the next decade. Zoom out, extend your time horizon, and you'll see why "up and to the right" remains the long-term game—so long as the money printer stays plugged in.
QQQ
Signs We May Be Nearing a Short-Term Peak
Bearish Divergence on RSI
We now have three higher highs in price paired with three lower lows in RSI. This signals a slowdown in bullish momentum. It’s not inherently bearish, but it does suggest the bulls are losing some steam. We saw this same divergence back in 2018—it took 80 days before it finally broke down with an 8% correction.Falling Volume Since the May 12 Gap
As we’ve continued to grind higher, volume has declined. That, combined with weakening RSI, signals this move could be running out of juice.Breadth is Narrowing
Fewer and fewer stocks are participating in the rally. Fewer than 50% of names in the S&P 500 are above their 200-day moving averages, even as SPY pushes higher. This means the big names—MSFT, NVDA, AVGO, META, JPM—are doing all the heavy lifting.
This narrowing breadth usually resolves one of two ways
The laggards play catch-up, leading to broad market rotation higher.
Or the leaders finally pull back—and everyone drops together.
Which scenario you think is going to play out really depends on your 2–3 month outlook.
RSP Still Lagging
The equal-weighted S&P (RSP) isn’t making new all-time highs, and it’s showing bearish divergence on its recent moves. Yes, it’s now above its long-term daily moving averages—which is a win for the bulls—but it’s still trailing behind the cap-weighted index.
S5TH
What’s Next?
SPY looks set to break into new all-time highs on Friday, with a short-term target zone between $616 and $629 over the coming weeks. If we then see a breakdown below our key SPY and QQQ trendlines, get ready to buy the dip at the levels we’ve outlined:
SPY first key support: $575
QQQ first key support: $495
Until then, stay bullish, trail your stops, and keep your eyes on those key pivot levels.
Bitcoin Post Script
What would a Market Milestone be without a Bitcoin update? Incomplete—that’s what.
However, don’t expect me to write weekly updates on BTC during the depths of crypto winter. I’ll be far too busy garage sale-ing all my belongings to buy every last satoshi possible… and crying myself to sleep each night for not selling at the exact top so I could rebuy the exact bottom like an absolute legend.
Anyway, BTC isn’t making new all-time highs alongside the market just yet. It’s only about 4% off, so not a dramatic divergence, but still notable. It’s lagging a bit right now.
Currently, I have three main counts for Bitcoin:
Orange and Green counts: These both suggest further dips into the mid to low $90Ks. If that full correction plays out, it could develop into face-ripping bullish moves to close out the year.
Blue count: This count has BTC’s low in with it breaking out soon and heading toward Target 1. It’s the less bullish scenario, still solid—but by Bitcoin standards, a tepid end to the bull run.
Whichever way this resolves, BTC still looks poised to head higher in 2025. If we dip first, I’ll be a buyer in the green box.
BTC
ABOUT REAL LIFE TRADING
We are a stock trading education company. Our goal is to teach and empower people to create generational wealth to enrich their lives and communities.
ONLINE TRAINING LINKS
