
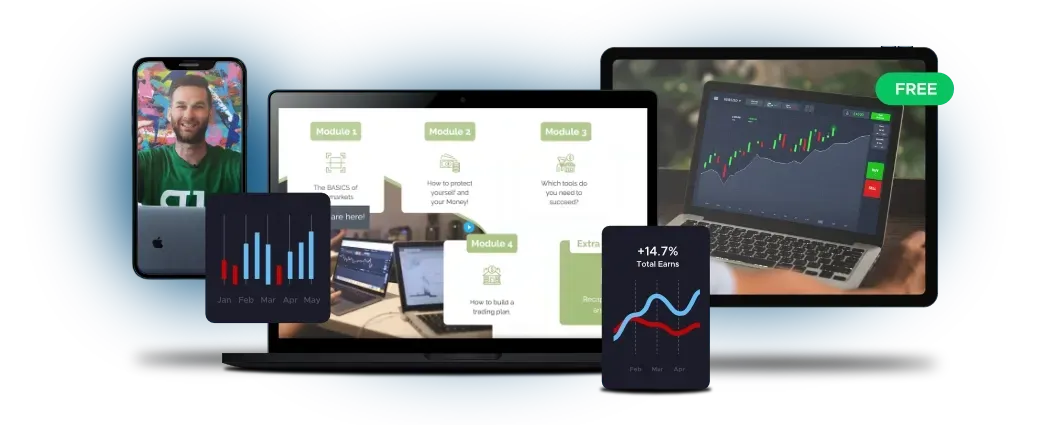
Claim Your FREE Trading Video Course
Get Our FREE Step-By-Step Video Course & See How You Can Start Trading For Cash Flow In Less Than 2-hours Per Week!
No Matter Whether You Are Trying To Boost Your Income, Escape The 9-5 Or Retire Early - We’ll Show You The Potential Fast-Track To Safe & Profitable Trades - Without Gambling Or Guesswork!
I Have Some Trading Experience
Enter Your Details Here To Start Your FREE Beginner's Guide to Trading Video Course Today!
As Featured In

I’m New to Trading | I Have Some Trading Experience
Get Our FREE Step-By-Step Video Course & See How You Can Start Trading For Cash Flow In Less Than 2-hours Per Week!
No Matter Whether You Are Trying To Boost Your Income, Escape The 9-5 Or Retire Early - We’ll Show You The Potential Fast-Track To Safe & Profitable Trades - Without Gambling Or Guesswork!
As Featured In

Welcome to the Real Life Trading Community
We’re A Stock Market Education Company - Run By Traders For Traders.
Our mission is to enrich lives by empowering people to trade the stock market confidently, safely and with predictable, consistent profit. As the highest-rated stock market education company in the world, we’ve trained over 20,000 traders and earned a reputation for teaching the real skills that lead to lasting success - not gimmicks that worked once.
Why Active Trading Done Right, Could Offer Faster Results, Higher Returns & Less Risks!
We’re A Stock Market Education Company - Run By Traders For Traders.
You’ve seen the wealth-building potential of trading. Maybe you’ve watched people make obscene amounts with meme stocks like GME or heard stories of wild bets turning into fortunes. That’s not what we’re about though…
At Real Life Trading, we focus on practical, calculated “Real Life” strategies - not YOLO gambling on a hunch.
Now, it’s true that “buy-and-hold” investing strategies work great (we even talk about them in this free course)…
But they only work if you have time on your side. If you started early enough … and don’t need your money now.
But consider this: after the dot-com bubble burst in 2000, it took the Nasdaq 15 years to recover its losses. What if that happened today - would you work longer or retire poorer?
Active trading puts the power in your hands.
With the right tools and strategies, you can take control of your financial future - with a chance to see bigger returns, faster… and create income on your terms!
Free Instant Access
Enter Your Details To Claim Your FREE Video Course Now!
Free Instant Access
Claim Your FREE Video Course Now!
Enter Your Details To Start Your FREE Beginner Trading Video Course Today!
The Biggest Risk Isn’t Starting - It’s Doing Nothing!
Let’s face it: starting something new can feel overwhelming. If you’ve never done it before, active trading can certainly seem chaotic and risky.
You may be thinking:
Where do I even begin?
What if I make a mistake and lose everything?
Is this too complicated for me?
And a hundred other questions. We understand. We were once where you are now!
That’s why we’re here to guide you step-by-step, making trading simple, safe, and approachable.
And to be clear - if you follow the steps in our video training, you will not risk losing everything.
In fact, the biggest risk is… doing nothing!
While others are creating consistent profits and snowballing their wealth - you could be left wondering, “What if I had started sooner?”
And with our 100% Free Beginners Trading video course you have nothing to lose and everything to gain here today!
Introducing
Introducing
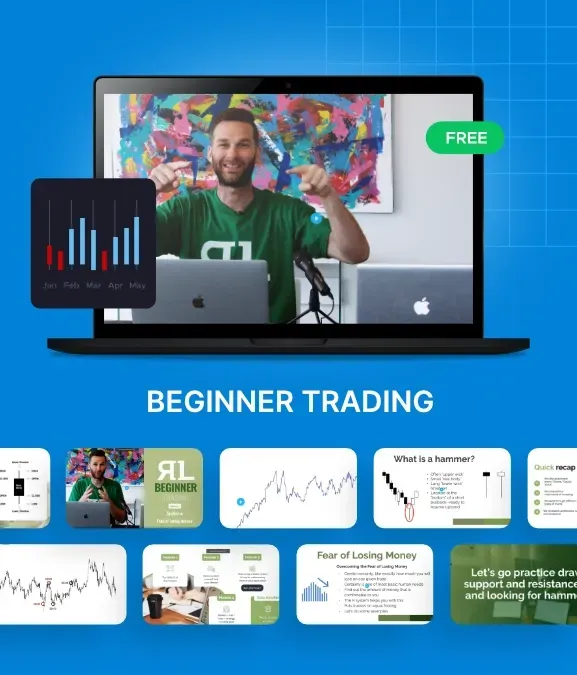
Your FREE Beginner’s Trading Video Course
Get Instant Access To Our Million-Dollar Stock Strategy!
Unlock Your Power & Potential To Make
Money - Anytime… From Anywhere!


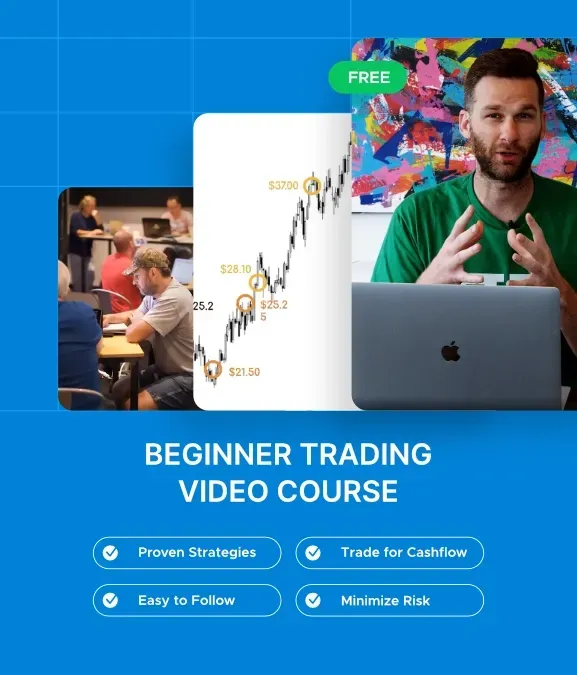
Proven
Strategies
Proven Strategies
Copy our proven trading strategies, so you can potentially start making money immediately!

Recommended
Stocks
Recommended Stocks
Get our personal stock recommendations that work best with these proven strategies.

Safe
Trading
Safe Trading
Follow this easy risk management formula to trade safely while potentially growing your wealth over time!

Bigger
Gains
Bigger Gains
Discover how active trades can potentially double or triple in a day vs. waiting a year to get 8% (if you’re lucky)

Faster
Results
Faster Results
Forget about holding stocks for decades. See how quick in-and-out trades can potentially achieve better results in weeks… sometimes days!

More Predictable
More
Predictable
See how to free yourself from an unpredictable market and potentially profit when the market moves up, down… or not at all!
Free Instant Access
Free Instant Access
Join The 60,000+ Traders Who Already Took This First Step & Get Instant Access Your Free Video Course Today!
Why On Earth Is This FREE?
That’s an excellent question…
We could certainly charge a pretty penny for step-by-step video training of this quality.
However, at Real Life Trading, we believe education should come first and we want to earn your trust. In our world, it’s only fair that we prove ourselves before we even think about asking for money.
Too often, other trading programs charge hundreds, or even thousands, of dollars for a fraction of the education you’re about to get here for free. We don’t think that’s right!
Our mission is to empower you with the skills and knowledge to trade confidently and profitably without making you gamble your hard-earned money on empty promises.
But we also want to be 100% honest with you. We know the value of what we offer, and we’re confident that once you see the results you can achieve with this free course, you’ll want to continue learning with us. That’s why we’re happy to give you this first step for free… with no trial, no commitment and absolutely zero strings attached!
Does that sound fair?
Testimonials
Testimonials
See What Others Traders Say About Us And Our Trading Video Courses

The best trading education I have come across...
“Easily the best trading educator I have come across. RLT is filled with the most genuine and caring people you'll ever meet. They are all super knowledgeable about the stock market and want to see you win. It's so refreshing to meet people who don't just want your money. They are one big family.”
Peter Sidewell
So glad to have found RLT...
“Incredibly inspiring, totally transparent, and excellent education. RLT provides a ton of ways for people to learn how to trade for both the short term (day trading) and long term (investing). You can tell they actually want people to succeed in every area of their life, not just the charts. If you are looking to learn more about trading the stock market, futures, crypto, or anything with a chart, this is the company to learn from!”
Chris Allen
Very supportive...
“So many great things to say about Real Life Trading!! RLT has provided the tools for me to not only begin my trading career but accelerate it as well. The environment at RLT is like a family and the knowledge base is ever expansive. The responsiveness of the team is unmatched and there's no question anyone on the team isn't willing to help you with.”
Jennifer Thompson
Real Trades. Real Results.
Real Profits.
Real Trades. Real Results. Real Profits.
Choose from 100s of hours of free online courses to learn how to
earn extra income, pay off debt, retire earlier
We are the highest-rated stock market education company in the world

Highly-Rated by customers and industry experts


See How You Could Have Found Trades Like These
These trades were executed using the exact strategies you’re about to discover in the free video course!
Trading isn’t about winning every time though - it’s about consistency. With the right risk management strategy, even a 50% success rate will turn into long-term profits. But at Real Life Trading, we aim higher. Last year, our strategies delivered an 80% success rate, proving that discipline and risk management pay off.
This Is Where Your Trading Success Story Begins!
You’re just one step away from becoming a more successful and consistent trader with the potential to see higher returns, faster.
Armed with our FREE Beginner’s Trading Video Course, you’ll gain the tools, strategies, and confidence. Not just to get started with trading, but to take control of your financial future… and potentially the power to make money - anytime… from anywhere!
Here’s what you’ll get instant access to today:
Our Proven Day-Trading Strategy: Clear, actionable steps to start trading profitably.
Stock Recommendations: that align perfectly with our strategy.
Risk Management Formula: Trade safely and grow your account with confidence.
Lifetime Access to Course Materials: Revisit lessons anytime to stay sharp.
Quick, Actionable Results: See how to potentially make money in days or weeks, not decades.
The Power to Profit in Any Market: Strategies that work whether markets are up, down, or sideways.
Claim Your Free Trading Video Course Now!
Frequently Asked Questions
Do I need any prior trading experience to take this course?
Not at all! This course is designed specifically for beginners. We’ll guide you step-by-step, starting with the basics, so you can build a strong foundation—even if you’ve never made a trade before.
How much money do I need to start trading?
You don’t need a huge account to begin. Many of our students start with as little as $500 to $1,000. Plus, you can even practice risk-free by paper trading—simulating trades without using real money—until you’re confident and ready to trade live.
How long will it take to complete the course?
The course is just one hour long, but you’ll have lifetime access to revisit the material anytime you need a refresher or want to sharpen your skills.
Is this really free? What’s the catch?
Yes, it’s 100% free—no catch, no strings attached. At Real Life Trading, we believe in earning your trust first by giving you real value upfront. We’re confident that once you see the results you can achieve, you’ll want to explore more with us.
Can I really make money day trading?
Yes, with the right strategies, discipline, and guidance, day trading can be highly profitable while minimizing risk. Our methods focus on safe, calculated trades to help you grow your account over time.
What happens after I complete the course?
After completing the course, you’ll have the tools and confidence to start making trades. Plus, you’ll unlock access to all our other free courses, including advanced resources for experienced traders. Register now and take advantage of everything we offer - at no cost!
What if I already have some experience trading?
We believe that you will learn something new from this course no matter how experienced you are… even if it’s just one new strategy or one new way of looking at an opportunity in the market. Also once you get inside you will unlock free access to dozens of more free video courses, some of them much more advanced than this one. You can learn as you grow and grow as you learn.
FREE Video Course
FREE Video Course
This Is Where Your Trading Success Story Begins!
You’re just one step away from becoming a more successful and consistent trader with the potential to see higher returns, faster. Enter your details and get instant access to your FREE video course today!

Helpful Links
CONTACT ↓
LOVE LIFE, LIVE LIFE & TRADE IT
Customer sUPPORT is available
M-F from 9am-5pm ET.
* All investments carry a certain level of risk, including the potential loss of principal invested. No investment strategy can guarantee a profit or protect against loss in periods of declining values. Please consider your objectives and risk tolerance before investing. Past performance is not indicative of future results.
© Copyright 2026 Real Life Trading, All Rights Reserved


