
I Have Some Trading Experience
RLT NEWSLETTER
Helping Everyday Traders Beat the Market with Practical, Realistic Strategies
At the RLT Newsletter, our mission is simple: to educate and empower ordinary people to take control of their financial futures and manage their investments with confidence. We strive to help regular individuals like you invest and protect their hard-earned money to build a better life for themselves and their families.
Whether you're a beginner or a seasoned investor, our rules-based systems and clear analysis are designed to help you grow your wealth effectively—while giving you more time to focus on what truly matters in your life.
I’m New to Trading | I Have Some Trading Experience
RLT NEWSLETTER
Helping Everyday Traders Beat the Market with Practical, Realistic Strategies
At the RLT Newsletter, our mission is simple: to educate and empower ordinary people to take control of their financial futures and manage their investments with confidence. We strive to help regular individuals like you invest and protect their hard-earned money to build a better life for themselves and their families.
Whether you're a beginner or a seasoned investor, our rules-based systems and clear analysis are designed to help you grow your wealth effectively—while giving you more time to focus on what truly matters in your life.


Join the RLT Newsletter today to take back your time and secure your financial future.
Our expert market analysis and proven, rules-based trading systems empower you to approach the stock market with confidence, discipline, and clarity. It’s time to overcome the challenges holding you back, face the market head-on, and come out victorious. The stock market is the best wealth creation device known to man and it’s time for you to start actively participating in it. Let us help you thrive!
Just $59/Month
Take Control of Your Financial Future
And Build the Life You Have Always Dreamed Of
Your Success, Our Mission: Empowering You to Win in the Market
Just $59/Month
Stay Informed: Receive 4 emails per week with market news and key price updates.
Follow Proven Systems: Gain access to 4 live trading portfolios, updated in real-time.
Save Time: Make adjustments to your portfolio in just minutes each day.
Gain Confidence: Learn from clear, concise charts and expert analysis tailored for all skill levels.
Master the Market: Dive deep into technical analysis with insights on gap dynamics, macro trends, Fibonacci retracements, and Elliott Wave theory.

At Real Life Trading, We Understand The Challenges You're Facing, Whether You're Just Starting Out Or Trying To Break Through To Consistent Profitability
What's' Included With The RLT Newsletter:
ONE
live trading portfolios
Long-term Swing Trading
Long-term Investing
Momentum Trading
TWO
4 weekly newsletters
with trade alerts, stock picks, and market insights
THREE
A weekly video
featuring market rundowns and top stocks to watch
FOUR
On-demand support
from an expert team of investors.
FIVE
Portal access
to track all actively managed portfolios
SIX
Slack access
to engage daily with our market analysts and the community
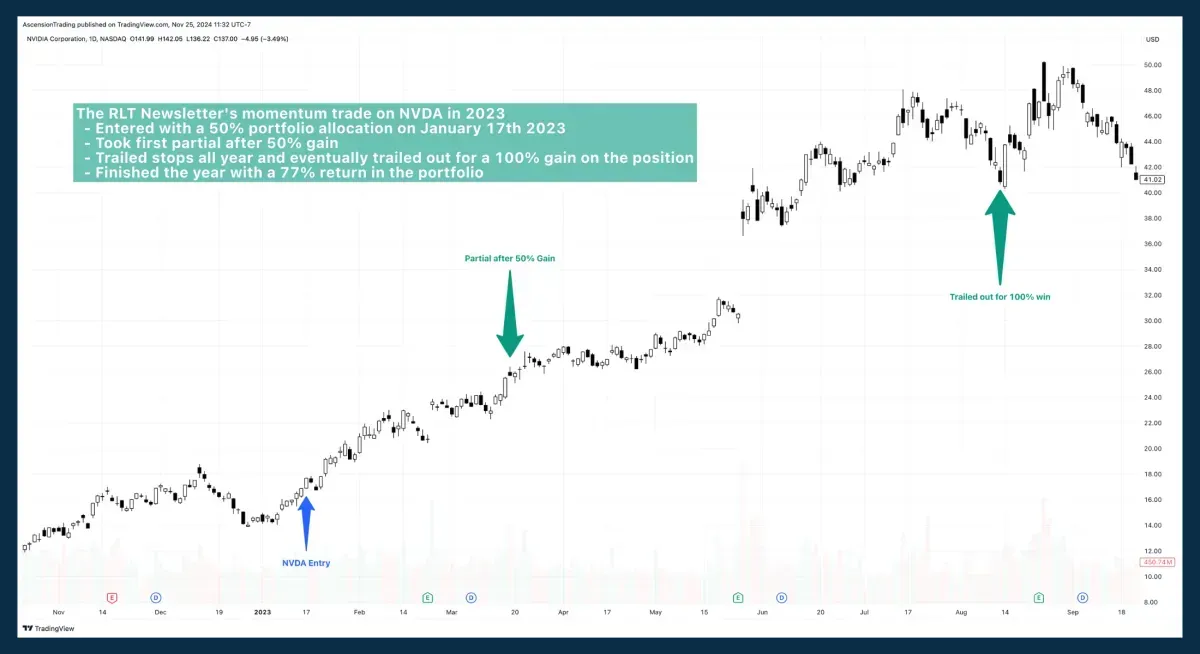
Our Momentum Trading Plan
gets you exposure to the strongest stocks on the planet and helps you ride them higher for serious profits.
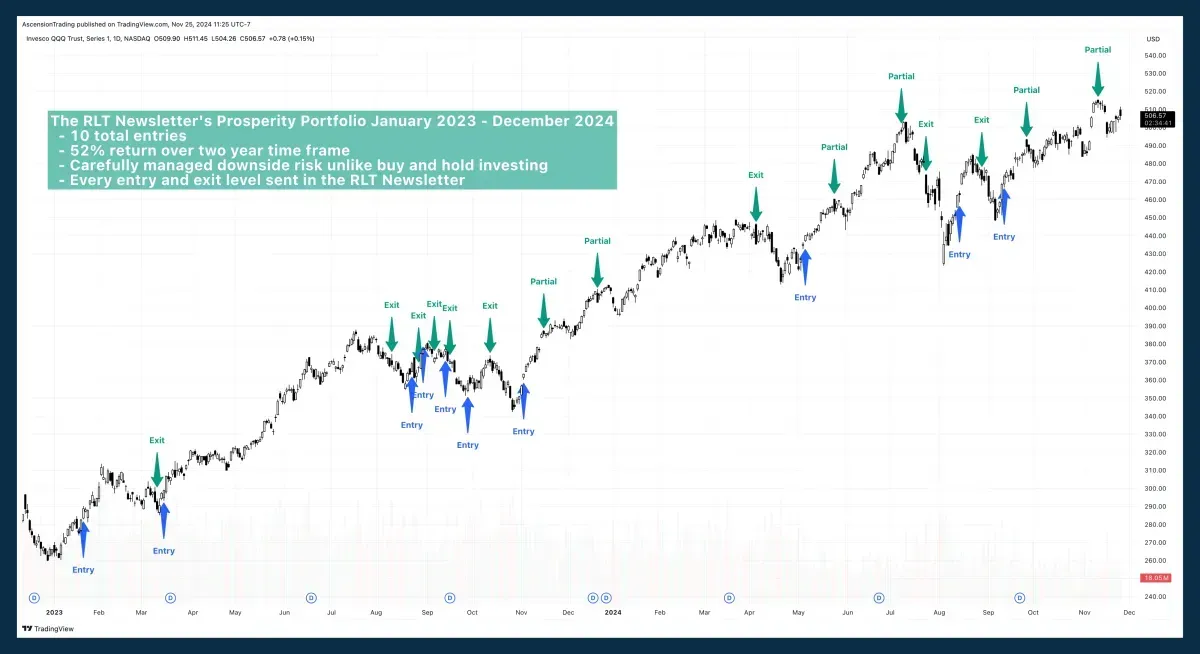
Our Prosperity Portfolio
helps traders beat the market with just a few trades each year while managing downside risk. This slow and steady system is perfect for retirement accounts, long term trading accounts or anyone who wants amazing returns with very little time commitment.
Free Instant Access
RLT Promise
Choose Excellence, Choose Results: Here’s Why We’re Your Best Bet
The Real Life Trading Newsletter stands apart from other financial publications by embracing a rules-based approach to the market and offering a genuine and realistic approach to the realities of trading. We recognize that trading entails both wins and losses, which is why we provide our members with straightforward, realistic expectations. Our commitment to transparency and authenticity combined with our sincere desire to empower our subscribers to reach their financial goals is what sets us apart. Join us as we take our trading skills and our trading accounts to the next level.
Your Success, Our Mission: Empowering You to Win in the Market
Just $59/Month
Stay Informed: Receive 4 emails per week with market news and key price updates.
Save Time: Make adjustments to your portfolio in just minutes each day.
Follow Proven Systems: Gain access to live trading portfolios, updated in real-time.
Gain Confidence: Learn from clear, concise charts and expert analysis tailored for all skill levels.
Master the Market: Dive deep into technical analysis with insights on gap dynamics, macro trends, Fibonacci retracements, and Elliott Wave theory.
Testimonials
Testimonials
See What Others Traders Say About Us And Our RLT Newsletter

A Lifesaver for Busy Traders: How the RLT Newsletter Makes Every Hour Count
“I just can't stress enough how much I love your newsletters and how grateful I am for them. For a full time worker like myself that only has 1 hour a day to work on trading, it's a life saver! Thank you for all your time and effort putting them together!”
Christopher W.
Finding the Perfect Fit: How the RLT Newsletter and Community Inspire Growth and Impact
“The RLT newsletter has been the right fit for me in the RLT community! I am hoping to continue to find ways to evolve, get more involved and use this education to change lives. Love your mission and the community of helpful people.”
Brian H.
From Confidence to Cash Flow: How the RLT Newsletter Transformed My Trading
“The Newsletter has increased my monthly cash flow, and it has given me the confidence to make my own trades based on the technical analysis provided. This Newsletter is an amazing value for the price. Highly recommended!”
David Castro
Frequently Asked Questions
How many emails will I receive each week?
You’ll receive 4 regular weekly emails on Monday, Tuesday, Thursday, and Friday. Additionally, you’ll receive occasional emails with portfolio updates as needed.
Can I cancel my monthly subscription anytime?
Yes! If you’re on the $59 monthly plan, you can cancel anytime, and your subscription will continue through the end of your current billing period.
Are the RLT Newsletter portfolios traded with live money?
No, all RLT Newsletter portfolios are tracked in a simulated, paper trading account for educational and entertainment purposes only. Our goal is to teach traders how to manage risk and their own portfolios effectively. We are stock market educators, not financial advisors. If you need personalized financial advice, we strongly encourage you to consult a qualified financial professional.
Do the RLT Newsletter analysts take all the trades in the portfolios?
No, the analysts do not personally take every trade in the portfolios.
Are the stocks reviewed in the Tuesday Top Trade Video part of the portfolios?
Not necessarily. While active or prospective trades for the portfolios may occasionally be discussed, the majority of the video focuses on general market reviews and stock charts that appear interesting from a technical analysis perspective.
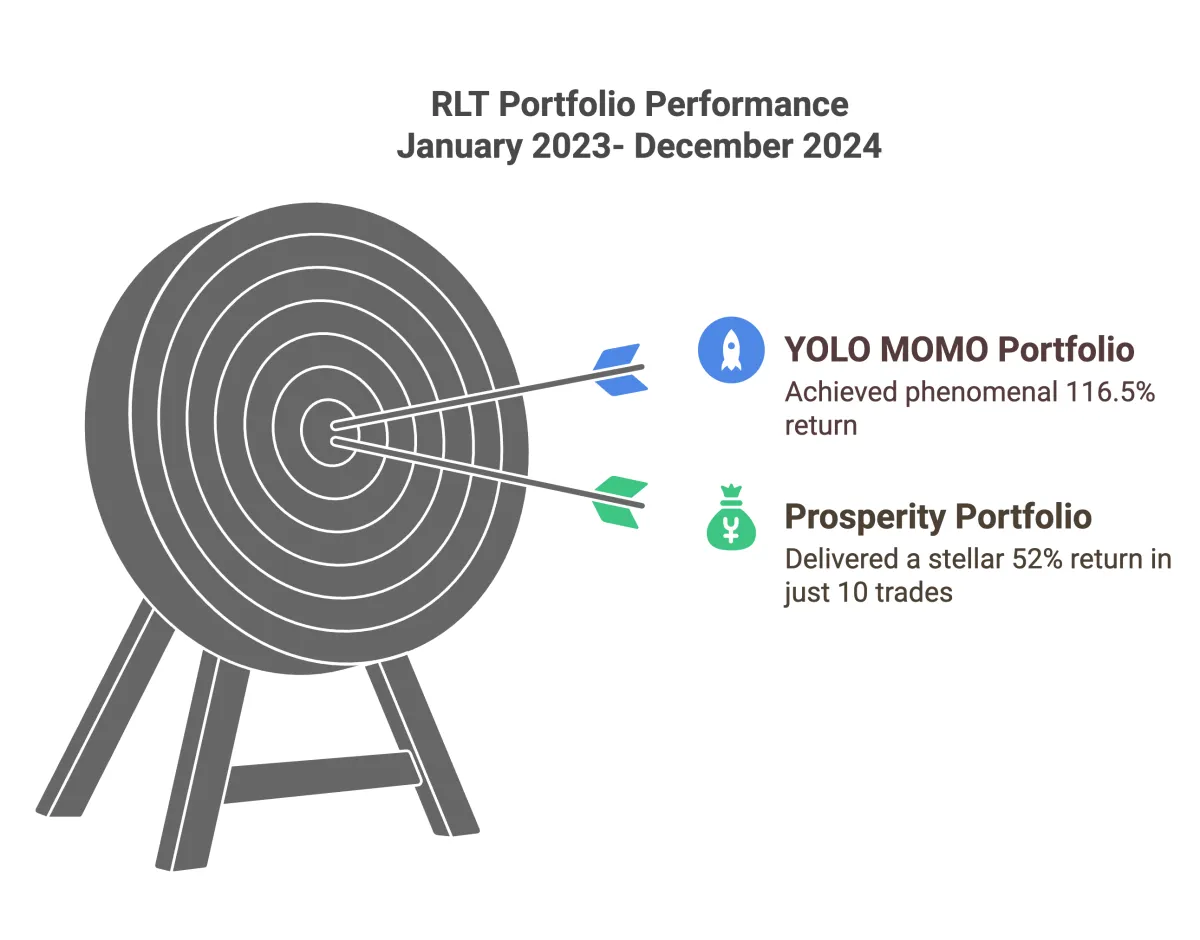
What is the Prosperity Portfolio?
The Prosperity Portfolio is a long-term swing trading system that focuses exclusively on the QQQ. This long-only strategy aims to outperform the market by staying out during bearish periods and remaining invested during bullish trends. Unlike traditional buy-and-hold strategies, it actively manages downside risk, making it ideal for long-term investors seeking steady growth with reduced volatility. With only a handful of trades each year, it’s a time-efficient resource for those who want to grow their portfolio without the need for frequent trading.
What is the YOLO MOMO Portfolio?
YOLO, short for “you only live once,” paired with MOMO, short for “momentum,” defines the essence of the YOLO MOMO Portfolio. This momentum-driven, aggressive swing trading strategy focuses on capturing significant moves in the market’s strongest-performing tech stocks. With an emphasis on relative strength and excellent risk-reward setups, this system offers the potential for outsized returns. It comes with high volatility and large portfolio swings, making it an ideal resource for traders seeking aggressive growth and who are comfortable taking on higher levels of risk.
What is the RL Swing Stalker Portfolio?
The RL Swing Stalker Portfolio is a short-term swing trading system that leverages advanced market scans to uncover opportunities. Using the R system for precise risk management, this strategy takes both bullish and bearish trades to maximize profit potential. It’s an ideal resource for active traders looking for a system with well-defined risk parameters and frequent trading opportunities.
What is the HODL Hero’s Portfolio?
The HODL Hero’s Portfolio is a long-term investing strategy aimed at achieving substantial returns by holding high-quality stocks for extended periods. Risk is managed using advanced options strategies. This long-term portfolio does not use the R system for risk management, meaning it can experience larger drawdowns. This portfolio is a resource for long term investors focused on long-term growth and who are willing to embrace more volatility.
DISCLAIMER - PLEASE READ BEFORE MAKING ANY RLT NEWSLETTER TRADES
Disclaimer: Each portfolio in the RLT Newsletter is a hypothetical paper trading account. Real Life Trading and its analysts use these portfolios as an educational tool. It’s important to note that Real Life Trading nor its analysts are actively managing live, real-money portfolios. The analysts and moderators may or may not trade any of the given equities.
CFTC Rule 4.41: These results are based on hypothetical or simulated performance results with inherent limitations. Unlike actual performance records, these results do not represent real trading. Because these trades haven't been executed, the results may have under- or over-compensated for the impact of certain market factors, such as the lack of liquidity. Hypothetical or simulated trading programs are designed with the benefit of hindsight, and no representation is being made that any account will or is likely to achieve profits or losses similar to those shown.
Trading Risks: Real Life Trading LLC (“Company”) is not an investment advisory service, nor a registered investment advisor or broker-dealer and does not purport to tell or suggest which securities customers should buy or sell for themselves. The independent contractors, employees or affiliates of Company may hold positions in the stocks, options, currencies or industries discussed here. You understand and acknowledge that there is a very high degree of risk involved in trading securities, options and/or currencies. The Company assumes no responsibility or liability for your trading and investment results. It should not be assumed that the methods, techniques, or indicators presented will be profitable or that they will not result in losses. Past results of any individual trader or trading system presented by the Company are not indicative of future returns by that trader or system, and are not indicative of future returns which will be realized by you. In addition, the indicators, strategies, and all other features of Company’s products (collectively, the “Information”) are provided for informational and educational purposes only and should not be construed as investment advice.

Helpful Links
* All investments carry a certain level of risk, including the potential loss of principal invested. No investment strategy can guarantee a profit or protect against loss in periods of declining values. Please consider your objectives and risk tolerance before investing. Past performance is not indicative of future results.
© Copyright 2025 Real Life Trading, All Rights Reserved


