START TRADING WITH CONFIDENCE
JOIN A COMMUNITY COMMITTED TO YOUR SUCCESS
Are you new to trading and ready to make your mark? Or do you have experience but are struggling to become a consistently profitable trader?
Imagine having a community of like-minded traders and experts at your side, helping you navigate every step of the journey!
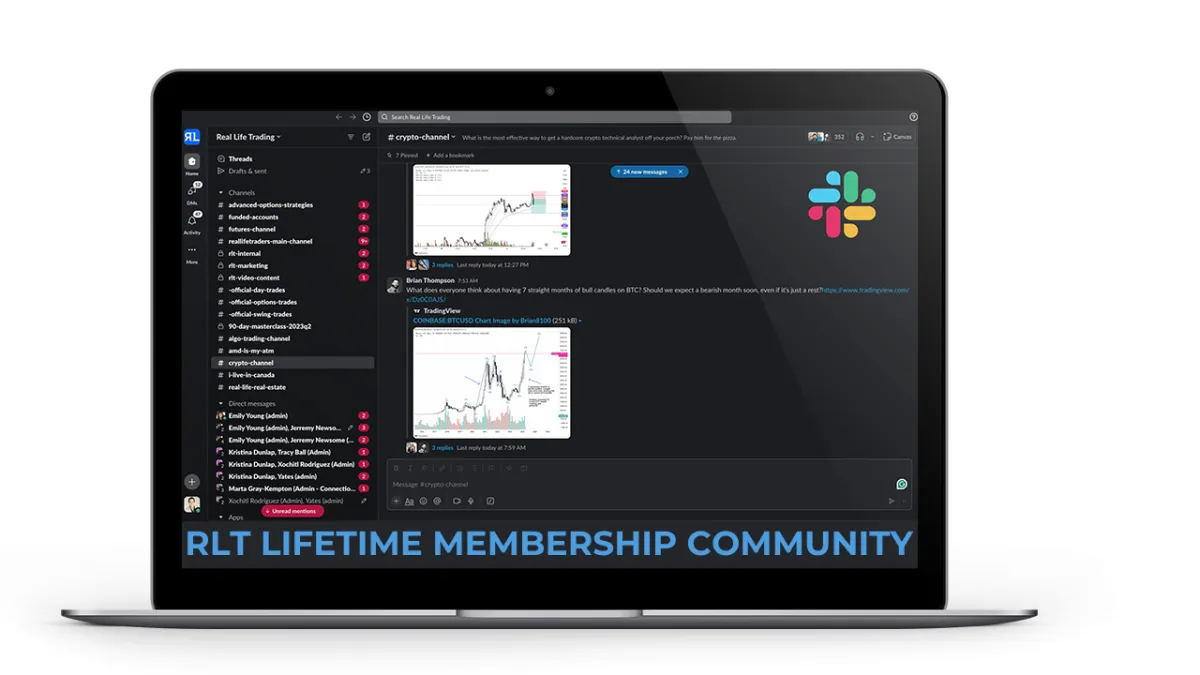
Join us and gain lifetime access to our exclusive Slack community—where you’ll find real-time support, valuable insights, and camaraderie with fellow traders. With FREE monthly courses and weekly live education sessions, we’re here to guide you every step of the way. Whether you're just starting out or looking to enhance your skills, you’ll have the tools and community you need to trade with confidence.
Start your journey today with a community dedicated to your success with a one-time $25 investment!
CREATE CASH FLOW AND KEEP IT
RETIRE EARLY AND LIVE THE LIFE YOU WANT

We teach people how to make money from the stock and crypto markets and KEEP IT by following simple and proven strategies that have generated $10,000,000+ for our customers and their families.
Tired of working for someone else? Dream of trading full-time?
Now’s your chance to make it happen!
Become a Full-Time Trader in 2025 with Tony Pawlak's
Elite 10-Month Premier Coaching Program !
Registration Only Opened Once a Year!
This isn’t just another program —
it’s a proven pathway to success. Over the years, Tony has helped countless students quit their jobs and transition into full-time trading. Through personalized coaching and hands-on training, he will guide you step by step to ensure you not only learn, but master the essential skills needed to consistently win in the markets.
AS FEATURED IN

Want to Trade LIVE with other TRADERS?

Get signed up for our immersive, high-energy, active stock trading rooms.
You'll get detailed insights on entries, exits, targets, and explanations.
We answer viewer questions in real time.

Get All Access to All Live Trading Rooms + Slack + RLT Newsletter
Just $275/Month - Best Value
Real-time trades you can follow
Exclusive Weekly Mentorships
Expert 1:1 trading support on demand
Access to a private slack group
Access to an incredible community of RLT traders to support you on your journey
Get access to live day trade & swing trading rooms
Live practice sessions/drills and strategies + get real-time feedback
Live market recaps and analysis
Weekly Q&A session to review your trades and answer your trading questions.
RLT Newsletter with trade alerts, stock picks and market analysis
Live Day Trading Room
Just $179/Month
Real-time trades you can follow
Expert 1:1 trading support on demand
Access to an incredible community of RLT traders
Get access to our live day trading room
Live practice sessions/drills and strategies + get real-time feedback
Live market recaps and analysis
Live SWING Trading Room
Just $149/Month
Real-time trades you can follow
Expert 1:1 trading support on demand
Access to an incredible community of RLT traders
Get access to our live swing trading room
Live practice sessions/drills and strategies + get real-time feedback
Live market recaps and analysis

RLT Education Programs
Mentorships

Unlock Your Trading Potential with
Funded Trading
Do you have the skills to trade, but lack the capital to make your mark in the markets?
Funded trading could be the solution you've been waiting for. With funded trading, you can trade with the backing of a funding company who will provide you with the trading capital, allowing you to focus on your strategy without the burden of risking your own capital.

Apex Trader Funding was established in
2021 with the goal of revolutionizing the trader payout model. It was founded out of dissatisfaction with existing funding companies and a desire to adopt a more customer-centric approach. As a premier trader funding company, Apex Trader Funding (ATF) outperforms other futures funding evaluation firms in terms of payouts. With a vast global community spanning over 150 countries and tens of thousands of members, Apex Trader Funding, headquartered in Austin, Texas, specializes in funding evaluations for futures markets.
Receive 100% of the first $25,000 per Account and 90% Beyond That
Two Payouts per Month
Trade Full-Sized Contracts in Evaluations or Funded Accounts
No Scaling or Failing by Going Over Contract Size
No Daily Drawdowns
Trade on Holidays
Trade Your Normal Day-to-Day Strategy or System During The News
No Total Cap on Maximum Payout
One-Step Evaluation Process
Real-Time Data Included
Simple Risk Management Rules
Trade With Multiple Accounts up to 20 max
If you’re a trader with the knowledge and skill but are held back by limited capital, Apex Trader Funding offers you the chance to access the capital you need to trade confidently.
Join the revolution in trading today with Apex Trader Funding, where your potential is funded, and your success is our priority.
FREE TRADING RESOURCES
Take FREE online courses to learn how to earn extra income while keeping your day job, Paying off debt, investing in your future, and Retiring Early
BEGINNER GUIDE TO DAY TRADING COURSE
FREE
BEGINNER GUIDE TO SWING TRADING COURSE
FREE
BEGINNER GUIDE TO INVESTING COURSE
FREE

GET TRADE ALERTS
Just $59/Month
Are you unable to find the time to build your own trading plans, do your own scans, or set up your own alerts? If so, our systems have you covered. Seize this opportunity to establish yourself as a consistent and disciplined trader and grow your trading account. Begin your journey today by subscribing to the RLT Newsletter.
MONEY MAKING BLOGS

Market Milestones: Bull Trap
Here we are again—another day when the relentless grind higher continues on the SPY despite all odds. PPI came in hot on Thursday, but no one cares. The market still assumes the Fed cuts in September, and pullbacks are simply not allowed around here. A few weeks ago we compared this persistent move higher with the 2024 bull market that never seemed to stop, and the similarities remain. That move went up 50% over the course of 480 days. Our current move has already gained 33% in just 129 days. If we get our first real correction at the same point we did during that market, the highs should come near the end of this month.
By then, SPY could easily be at $650 or $660. Even a modest 5-6% pullback from that level would likely not break the $620 key support before the uptrend resumes, pushing SPY into the $700 zone by the end of 2025. As long as key support holds, I think the correlation between now and the 2024 bull run shouldn’t be ignored. For what it’s worth, NVDA reports earnings on 8/27, and this bar pattern shows a high on 8/28 for the SPY. I think NVDA will crush earnings, but the question is whether they’ll crush them enough to spark another breakaway gap and send the largest stock in the world to a $5 trillion market cap. If that happens, all bets are off—we could be in for a melt-up worthy of the dot-com bubble, followed, of course, by something quite epic in the opposite direction.
SPY

Speaking of calamitous drops—this wouldn’t be a Market Milestones if I didn’t drone on about BTC for a bit, would it? I’ve been extra active in my Bitcoin analysis lately because we’re reaching a point where risk is elevated and a top is possible right now—something I haven’t said at any other point in this cycle. I’ve written multiple newsletters lately about the bullish case for $200K Bitcoin as well as the more bearish case for a top in the $120K–$140K range. I certainly hope Bitcoin goes much higher from here, but what I want doesn’t matter to the hardest asset on the planet.
On Thursday, BTC gave us a bull trap. It’s done so four other times in this cycle and twice—very notably—in the last cycle. Both the April and November 2021 tops had this exact pattern: an all-time-high trap followed by major drawdowns. Each time we’ve seen this bull trap, the market has dropped, broken its prior higher low, and seen the RSI dip to oversold (27 on the daily chart). I’ve used that oversold RSI as a remarkably accurate buy signal this cycle—especially when combined with bullish divergence.
BTCUSD

Here’s a look at the drawdowns after these bitcoin bull traps:
April 2021 – 55%
November 2021 – 77%
February 2023 – 22%
July 2023 – 22%
July 2024 – 30%
January 2025 – 32%
Perhaps this time is different and the bull trap leads only to only a modest pullback, with BTC holding the prior higher low at $112K. Maybe the pullback is even done already and we head higher from here. We’ll know soon.
However, history would warn that Bitcoin is setting up for more of a drop than most are anticipating. Bitcoin is once again running into resistance at the midpoint of the massive parallel channel that has held bitcoin since 2017 bull run. A 22% drop (seen twice this cycle) would take us into the lower trendline of the gray parallel channel which has held this entire bull run. If we start breaking below the gray channel and the trendline that’s supported this bull trend since the beginning, I’d consider this bull market in jeopardy. A break below the $88K key support? That’s life support territory. I’ll still follow my long-term rule of buying BTC when the daily RSI hits 27—and again on bullish divergence—but we’d then be at risk of retesting the broader parallel channel trendline (green line), which currently sits near $50K.
BTCUSD

Don’t get too discouraged, my fellow Bitcoin bulls. There’s still hope. We still have a few wave counts, several indicators, and plenty of on-chain metrics suggesting the top isn’t here quite yet. It’s entirely possible we’re just getting September weakness a bit early. Historically, the year after the halving has always—yes, always—seen a September pullback right before the final leg higher. This would also line up with possible September weakness we could see in the SPY if the yellow bars are accurate. If we do pull back into the $110K–$95K range, it could be the last shakeout before Bitcoin’s final push higher. One more shot at bull market gains before winter comes.

Market Milestones: Bull Trap
Here we are again—another day when the relentless grind higher continues on the SPY despite all odds. PPI came in hot on Thursday, but no one cares. The market still assumes the Fed cuts in September, and pullbacks are simply not allowed around here. A few weeks ago we compared this persistent move higher with the 2024 bull market that never seemed to stop, and the similarities remain. That move went up 50% over the course of 480 days. Our current move has already gained 33% in just 129 days. If we get our first real correction at the same point we did during that market, the highs should come near the end of this month.
By then, SPY could easily be at $650 or $660. Even a modest 5-6% pullback from that level would likely not break the $620 key support before the uptrend resumes, pushing SPY into the $700 zone by the end of 2025. As long as key support holds, I think the correlation between now and the 2024 bull run shouldn’t be ignored. For what it’s worth, NVDA reports earnings on 8/27, and this bar pattern shows a high on 8/28 for the SPY. I think NVDA will crush earnings, but the question is whether they’ll crush them enough to spark another breakaway gap and send the largest stock in the world to a $5 trillion market cap. If that happens, all bets are off—we could be in for a melt-up worthy of the dot-com bubble, followed, of course, by something quite epic in the opposite direction.
SPY
Speaking of calamitous drops—this wouldn’t be a Market Milestones if I didn’t drone on about BTC for a bit, would it? I’ve been extra active in my Bitcoin analysis lately because we’re reaching a point where risk is elevated and a top is possible right now—something I haven’t said at any other point in this cycle. I’ve written multiple newsletters lately about the bullish case for $200K Bitcoin as well as the more bearish case for a top in the $120K–$140K range. I certainly hope Bitcoin goes much higher from here, but what I want doesn’t matter to the hardest asset on the planet.
On Thursday, BTC gave us a bull trap. It’s done so four other times in this cycle and twice—very notably—in the last cycle. Both the April and November 2021 tops had this exact pattern: an all-time-high trap followed by major drawdowns. Each time we’ve seen this bull trap, the market has dropped, broken its prior higher low, and seen the RSI dip to oversold (27 on the daily chart). I’ve used that oversold RSI as a remarkably accurate buy signal this cycle—especially when combined with bullish divergence.
BTCUSD
Here’s a look at the drawdowns after these bitcoin bull traps:
April 2021 – 55%
November 2021 – 77%
February 2023 – 22%
July 2023 – 22%
July 2024 – 30%
January 2025 – 32%
Perhaps this time is different and the bull trap leads only to only a modest pullback, with BTC holding the prior higher low at $112K. Maybe the pullback is even done already and we head higher from here. We’ll know soon.
However, history would warn that Bitcoin is setting up for more of a drop than most are anticipating. Bitcoin is once again running into resistance at the midpoint of the massive parallel channel that has held bitcoin since 2017 bull run. A 22% drop (seen twice this cycle) would take us into the lower trendline of the gray parallel channel which has held this entire bull run. If we start breaking below the gray channel and the trendline that’s supported this bull trend since the beginning, I’d consider this bull market in jeopardy. A break below the $88K key support? That’s life support territory. I’ll still follow my long-term rule of buying BTC when the daily RSI hits 27—and again on bullish divergence—but we’d then be at risk of retesting the broader parallel channel trendline (green line), which currently sits near $50K.
BTCUSD
Don’t get too discouraged, my fellow Bitcoin bulls. There’s still hope. We still have a few wave counts, several indicators, and plenty of on-chain metrics suggesting the top isn’t here quite yet. It’s entirely possible we’re just getting September weakness a bit early. Historically, the year after the halving has always—yes, always—seen a September pullback right before the final leg higher. This would also line up with possible September weakness we could see in the SPY if the yellow bars are accurate. If we do pull back into the $110K–$95K range, it could be the last shakeout before Bitcoin’s final push higher. One more shot at bull market gains before winter comes.
ABOUT REAL LIFE TRADING
We are a stock trading education company. Our goal is to teach and empower people to create generational wealth to enrich their lives and communities.
ONLINE TRAINING LINKS
