
START TRADING WITH CONFIDENCE
JOIN A COMMUNITY COMMITTED TO YOUR SUCCESS
Are you new to trading and ready to make your mark? Or do you have experience but are struggling to become a consistently profitable trader?
Imagine having a community of like-minded traders and experts at your side, helping you navigate every step of the journey!
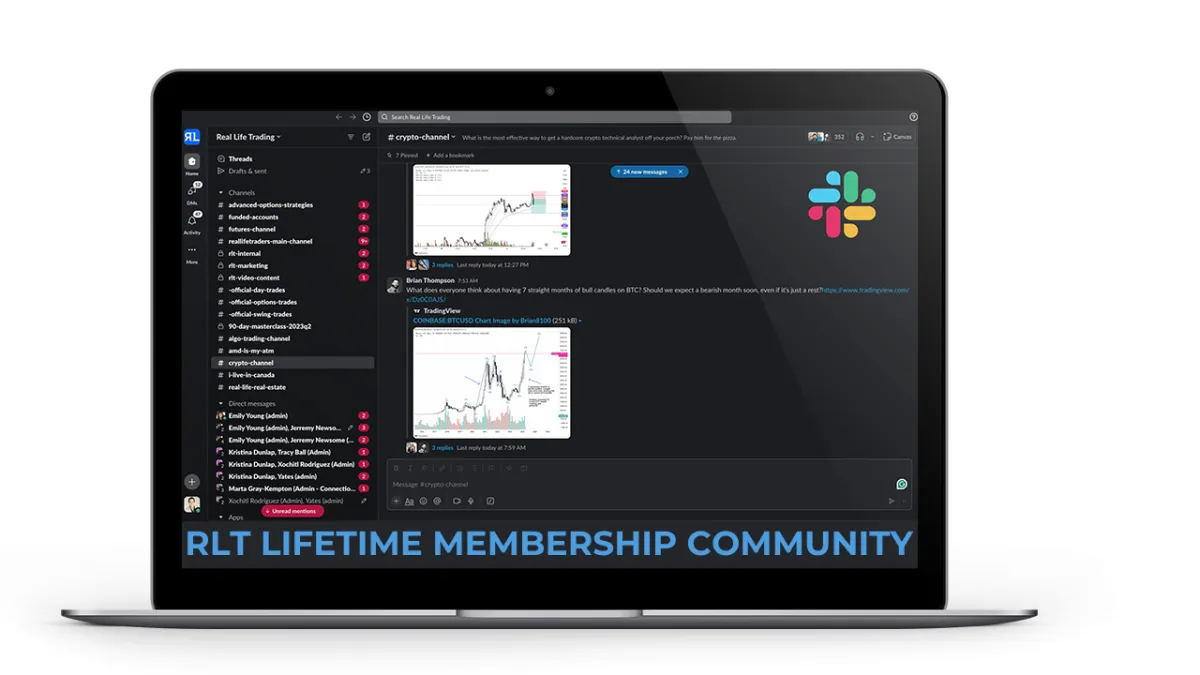
Join us and gain lifetime access to our exclusive Slack community—where you’ll find real-time support, valuable insights, and camaraderie with fellow traders. With FREE monthly courses and weekly live education sessions, we’re here to guide you every step of the way. Whether you're just starting out or looking to enhance your skills, you’ll have the tools and community you need to trade with confidence.
Start your journey today with a community dedicated to your success with a one-time $25 investment!
CREATE CASH FLOW AND KEEP IT
RETIRE EARLY AND LIVE THE LIFE YOU WANT

We teach people how to make money from the stock and crypto markets and KEEP IT by following simple and proven strategies that have generated $10,000,000+ for our customers and their families.
Tired of working for someone else? Dream of trading full-time?
Now’s your chance to make it happen!
Become a Full-Time Trader in 2025 with Tony Pawlak's
Elite 10-Month Premier Coaching Program !
Registration Only Opened Once a Year!
This isn’t just another program —
it’s a proven pathway to success. Over the years, Tony has helped countless students quit their jobs and transition into full-time trading. Through personalized coaching and hands-on training, he will guide you step by step to ensure you not only learn, but master the essential skills needed to consistently win in the markets.
AS FEATURED IN

Want to Trade LIVE with other TRADERS?

Get signed up for our immersive, high-energy, active stock trading rooms.
You'll get detailed insights on entries, exits, targets, and explanations.
We answer viewer questions in real time.
Get All Access to All Live Trading Rooms + Slack + RLT Newsletter
Just $275/Month - Best Value
Real-time trades you can follow
Exclusive Weekly Mentorships
Expert 1:1 trading support on demand
Access to a private slack group
Access to an incredible community of RLT traders to support you on your journey
Get access to live day trade & swing trading rooms
Live practice sessions/drills and strategies + get real-time feedback
Live market recaps and analysis
Weekly Q&A session to review your trades and answer your trading questions.
RLT Newsletter with trade alerts, stock picks and market analysis
Live Day Trading Room
Just $179/Month
Real-time trades you can follow
Expert 1:1 trading support on demand
Access to an incredible community of RLT traders
Get access to our live day trading room
Live practice sessions/drills and strategies + get real-time feedback
Live market recaps and analysis
Live SWING Trading Room
Just $149/Month
Real-time trades you can follow
Expert 1:1 trading support on demand
Access to an incredible community of RLT traders
Get access to our live swing trading room
Live practice sessions/drills and strategies + get real-time feedback
Live market recaps and analysis

RLT Education Programs
Mentorships

Unlock Your Trading Potential with
Funded Trading
Do you have the skills to trade, but lack the capital to make your mark in the markets?
Funded trading could be the solution you've been waiting for. With funded trading, you can trade with the backing of a funding company who will provide you with the trading capital, allowing you to focus on your strategy without the burden of risking your own capital.

Apex Trader Funding was established in
2021 with the goal of revolutionizing the trader payout model. It was founded out of dissatisfaction with existing funding companies and a desire to adopt a more customer-centric approach. As a premier trader funding company, Apex Trader Funding (ATF) outperforms other futures funding evaluation firms in terms of payouts. With a vast global community spanning over 150 countries and tens of thousands of members, Apex Trader Funding, headquartered in Austin, Texas, specializes in funding evaluations for futures markets.
Receive 100% of the first $25,000 per Account and 90% Beyond That
Two Payouts per Month
Trade Full-Sized Contracts in Evaluations or Funded Accounts
No Scaling or Failing by Going Over Contract Size
No Daily Drawdowns
Trade on Holidays
Trade Your Normal Day-to-Day Strategy or System During The News
No Total Cap on Maximum Payout
One-Step Evaluation Process
Real-Time Data Included
Simple Risk Management Rules
Trade With Multiple Accounts up to 20 max
If you’re a trader with the knowledge and skill but are held back by limited capital, Apex Trader Funding offers you the chance to access the capital you need to trade confidently.
Join the revolution in trading today with Apex Trader Funding, where your potential is funded, and your success is our priority.
FREE TRADING RESOURCES
Take FREE online courses to learn how to earn extra income while keeping your day job, Paying off debt, investing in your future, and Retiring Early
BEGINNER GUIDE TO DAY TRADING COURSE
FREE
BEGINNER GUIDE TO SWING TRADING COURSE
FREE
BEGINNER GUIDE TO INVESTING COURSE
FREE
GET TRADE ALERTS
Just $59/Month
Are you unable to find the time to build your own trading plans, do your own scans, or set up your own alerts? If so, our systems have you covered. Seize this opportunity to establish yourself as a consistent and disciplined trader and grow your trading account. Begin your journey today by subscribing to the RLT Newsletter.
MONEY MAKING BLOGS

Market Milestones: Decision Time
After a week filled with big ups and downs, Thursday brought a whole lot of indecision, setting the stage for a potentially explosive Friday. SPY is sitting at key support after essentially filling Monday’s retest gap. The 200-day SMA swatted the bulls harder than LeBron James blocking grade schoolers, sending hopes of a V-shaped recovery crashing back down. A lot of traders, myself included, locked in gains at that 200-day SMA, and the straight ballers among us grabbed a bunch of puts at that level.
Now that price has come back down to the very solid $565 support, there are some decent risk-reward setups on the bull side once again. Last Friday’s candle remains key for risk management—below that opens up a lot of bearish possibilities, and you’ll want to be protected if those start playing out.
Bear Case
Looking at the chart, the big gray boxes represent measured moves and outline what could be the “worst-case” scenario for bulls on this immediate leg lower. If the 200-day SMA marked the top, a C wave equal to the A wave would take us exactly to the 100-week SMA at $512. If SPY closes strongly below last Friday’s candle in the next few days, even the most bullish traders should consider this as a possibility. That said, even if SPY breaks last Friday’s low, strong support at $540.00 should at least provide a short-term bouncing spot.
Bull Case
On the bullish side, SPY needs to hold last Friday’s low and push back above the 200-day SMA. This would complete a C wave higher (in green), as the market continues to move in three-wave patterns in all directions. If that happens, shorts would likely scramble to cover, triggering a bit of a short squeeze. If SPY can reclaim the 200-day SMA, it should move quickly to the 100-day SMA, where it will hit resistance once again. If that happens, taking profits at that level would be a smart move for any positions entered near these lows. This setup is also present in key stocks like AAPL, AMZN, NVDA, META, and TSLA, offering strong risk-reward potential into the 100-day SMA.
SPY

Sentiment still remains in the gutter, with the Fear and Greed Index hovering near extreme fear at 28. The number of stocks in the Nasdaq above there 200-day SMA is at 37, the lowest its been since October of 2023. The bullish action on Monday and Tuesday wasn’t enough to shake out shorts triggering a squeeze higher or to start shifting sentiment back to neutral. Tariffs, debt, recession fears, and inflation are all fueling volatility, which is likely to persist in the near term.
Many stocks, especially the Magnificent 7, are sitting right at key support, waiting for a catalyst. April 2nd, dubbed “Liberation Day” by President Trump, could be just that. I suspect it may act as a price reversal catalyst, whichever way we’re trending into the announcement. Good news often turns into a “sell the news” event, and in this case, perceived bad news could actually spark a short-term bottom—especially if SPY sells off into the event and tariffs are less harsh than expected. However, keep in mind that all new tariff announcements have sent the market cliff diving for the past month, and that may not be changing any time soon. If tariff concerns disappeared tomorrow, I think the markets would be back at new all-time highs within weeks.
We are going to look at two charts now, perhaps the two charts I look at most, Bitcoin and Nvidia.
First up, the Bitcoin chart. Bitcoin has been holding above the 200-day SMA all week, showing impressive relative strength compared to the equity markets. This kind of resilience is exactly what I want to see. BTC needs to hold its 3/11 low, but ideally, it should hold above $80,000 on any further weakness.
That said, if SPY follows the bearish count outlined above, it’s hard to imagine Bitcoin holding up without breaking down as well—especially considering the massive influence of ETFs. When stocks sell off, people tend to ditch their high-flying Bitcoin ETF positions, knowing that BTC has a history of drawing down 60% or more in bear markets. However, with many stocks looking like they could be finding support and the potential for a bullish SPY scenario, Bitcoin could be setting up for a breakout to new all-time highs. That would make for a fantastic trade for anyone buying this recent dip.
Even now, the risk-reward setup is solid. The downside risk is about $10,000 from $85,000 to $75,000, where a stop or hedge would make sense. Meanwhile, the upside is around $30,000 into $116,000, which would only be 7% above the previous all-time high—likely a conservative target if BTC truly starts running. As I’ve said before, this isn’t the market to chase—it’s the market to buy as low as possible, even when it feels uncomfortable. Resistance will be tough at $92,000, $94,000, and $100,000, so even if BTC pushes higher, don’t expect smooth sailing to "Gainsville."
BTC

Now, onto Nvidia. NVDA has been showing real weakness, breaking through multiple key levels: its bullish trendline, 100-day SMA, and 200-day SMA. Recently, it even rejected off its former trendline and continued lower. The last major support sits at $111, which NVDA barely held onto Thursday. If it starts closing below that level, the probability of a move back into double digits increases, marking an incredible buying opportunity.
Right now, NVDA has a PE of 37 and a forward PE of 19. If NVDA drops another 15%, those valuation metrics will look even more attractive for a long-term position. Realistically, NVDA—and many of its fellow Magnificent 7 stocks—already appear undervalued when compared to some of the other largest U.S. companies. Check out the graph below for a breakdown of some of our favorite names.

The TL;DR on this chart: NVDA looks like a screaming buy if it ever reaches the 100-week SMA. In a prolonged bear market, it could drop all the way to the gap fill at $68.87, but I believe NVDA will be a $4 trillion company before 2030. That means a buy near the 100-week SMA could offer at least 85% upside in the coming years. Of course, risk still needs to be managed—if it drops below $68, it’s time to protect and hedge because something is up. Otherwise, I’ll be a buyer if we see a breakdown into strong support.
NVDA


Market Milestones: Decision Time
After a week filled with big ups and downs, Thursday brought a whole lot of indecision, setting the stage for a potentially explosive Friday. SPY is sitting at key support after essentially filling Monday’s retest gap. The 200-day SMA swatted the bulls harder than LeBron James blocking grade schoolers, sending hopes of a V-shaped recovery crashing back down. A lot of traders, myself included, locked in gains at that 200-day SMA, and the straight ballers among us grabbed a bunch of puts at that level.
Now that price has come back down to the very solid $565 support, there are some decent risk-reward setups on the bull side once again. Last Friday’s candle remains key for risk management—below that opens up a lot of bearish possibilities, and you’ll want to be protected if those start playing out.
Bear Case
Looking at the chart, the big gray boxes represent measured moves and outline what could be the “worst-case” scenario for bulls on this immediate leg lower. If the 200-day SMA marked the top, a C wave equal to the A wave would take us exactly to the 100-week SMA at $512. If SPY closes strongly below last Friday’s candle in the next few days, even the most bullish traders should consider this as a possibility. That said, even if SPY breaks last Friday’s low, strong support at $540.00 should at least provide a short-term bouncing spot.
Bull Case
On the bullish side, SPY needs to hold last Friday’s low and push back above the 200-day SMA. This would complete a C wave higher (in green), as the market continues to move in three-wave patterns in all directions. If that happens, shorts would likely scramble to cover, triggering a bit of a short squeeze. If SPY can reclaim the 200-day SMA, it should move quickly to the 100-day SMA, where it will hit resistance once again. If that happens, taking profits at that level would be a smart move for any positions entered near these lows. This setup is also present in key stocks like AAPL, AMZN, NVDA, META, and TSLA, offering strong risk-reward potential into the 100-day SMA.
SPY
Sentiment still remains in the gutter, with the Fear and Greed Index hovering near extreme fear at 28. The number of stocks in the Nasdaq above there 200-day SMA is at 37, the lowest its been since October of 2023. The bullish action on Monday and Tuesday wasn’t enough to shake out shorts triggering a squeeze higher or to start shifting sentiment back to neutral. Tariffs, debt, recession fears, and inflation are all fueling volatility, which is likely to persist in the near term.
Many stocks, especially the Magnificent 7, are sitting right at key support, waiting for a catalyst. April 2nd, dubbed “Liberation Day” by President Trump, could be just that. I suspect it may act as a price reversal catalyst, whichever way we’re trending into the announcement. Good news often turns into a “sell the news” event, and in this case, perceived bad news could actually spark a short-term bottom—especially if SPY sells off into the event and tariffs are less harsh than expected. However, keep in mind that all new tariff announcements have sent the market cliff diving for the past month, and that may not be changing any time soon. If tariff concerns disappeared tomorrow, I think the markets would be back at new all-time highs within weeks.
We are going to look at two charts now, perhaps the two charts I look at most, Bitcoin and Nvidia.
First up, the Bitcoin chart. Bitcoin has been holding above the 200-day SMA all week, showing impressive relative strength compared to the equity markets. This kind of resilience is exactly what I want to see. BTC needs to hold its 3/11 low, but ideally, it should hold above $80,000 on any further weakness.
That said, if SPY follows the bearish count outlined above, it’s hard to imagine Bitcoin holding up without breaking down as well—especially considering the massive influence of ETFs. When stocks sell off, people tend to ditch their high-flying Bitcoin ETF positions, knowing that BTC has a history of drawing down 60% or more in bear markets. However, with many stocks looking like they could be finding support and the potential for a bullish SPY scenario, Bitcoin could be setting up for a breakout to new all-time highs. That would make for a fantastic trade for anyone buying this recent dip.
Even now, the risk-reward setup is solid. The downside risk is about $10,000 from $85,000 to $75,000, where a stop or hedge would make sense. Meanwhile, the upside is around $30,000 into $116,000, which would only be 7% above the previous all-time high—likely a conservative target if BTC truly starts running. As I’ve said before, this isn’t the market to chase—it’s the market to buy as low as possible, even when it feels uncomfortable. Resistance will be tough at $92,000, $94,000, and $100,000, so even if BTC pushes higher, don’t expect smooth sailing to "Gainsville."
BTC
Now, onto Nvidia. NVDA has been showing real weakness, breaking through multiple key levels: its bullish trendline, 100-day SMA, and 200-day SMA. Recently, it even rejected off its former trendline and continued lower. The last major support sits at $111, which NVDA barely held onto Thursday. If it starts closing below that level, the probability of a move back into double digits increases, marking an incredible buying opportunity.
Right now, NVDA has a PE of 37 and a forward PE of 19. If NVDA drops another 15%, those valuation metrics will look even more attractive for a long-term position. Realistically, NVDA—and many of its fellow Magnificent 7 stocks—already appear undervalued when compared to some of the other largest U.S. companies. Check out the graph below for a breakdown of some of our favorite names.
The TL;DR on this chart: NVDA looks like a screaming buy if it ever reaches the 100-week SMA. In a prolonged bear market, it could drop all the way to the gap fill at $68.87, but I believe NVDA will be a $4 trillion company before 2030. That means a buy near the 100-week SMA could offer at least 85% upside in the coming years. Of course, risk still needs to be managed—if it drops below $68, it’s time to protect and hedge because something is up. Otherwise, I’ll be a buyer if we see a breakdown into strong support.
NVDA
ABOUT REAL LIFE TRADING
We are a stock trading education company. Our goal is to teach and empower people to create generational wealth to enrich their lives and communities.
ONLINE TRAINING LINKS