START TRADING WITH CONFIDENCE
JOIN A COMMUNITY COMMITTED TO YOUR SUCCESS
Are you new to trading and ready to make your mark? Or do you have experience but are struggling to become a consistently profitable trader?
Imagine having a community of like-minded traders and experts at your side, helping you navigate every step of the journey!
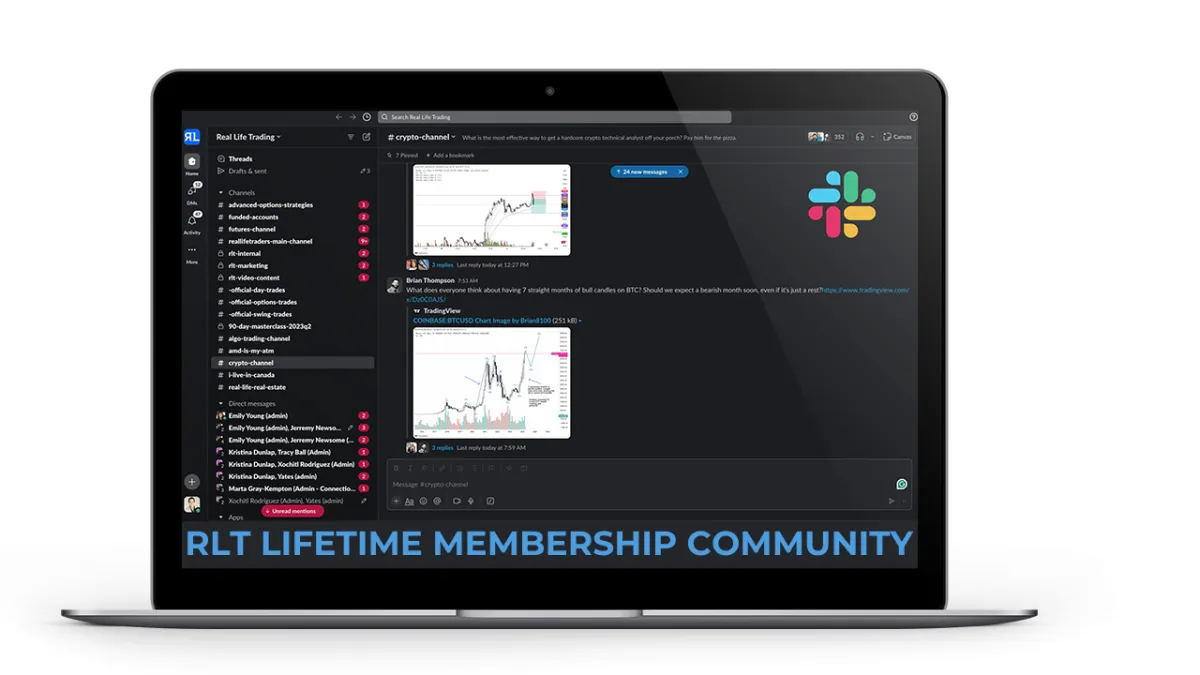
Join us and gain lifetime access to our exclusive Slack community—where you’ll find real-time support, valuable insights, and camaraderie with fellow traders. With FREE monthly courses and weekly live education sessions, we’re here to guide you every step of the way. Whether you're just starting out or looking to enhance your skills, you’ll have the tools and community you need to trade with confidence.
Start your journey today with a community dedicated to your success with a one-time $25 investment!
CREATE CASH FLOW AND KEEP IT
RETIRE EARLY AND LIVE THE LIFE YOU WANT
We teach people how to make money from the stock and crypto markets and KEEP IT by following simple and proven strategies that have generated $10,000,000+ for our customers and their families.
Tired of working for someone else? Dream of trading full-time?
Now’s your chance to make it happen!
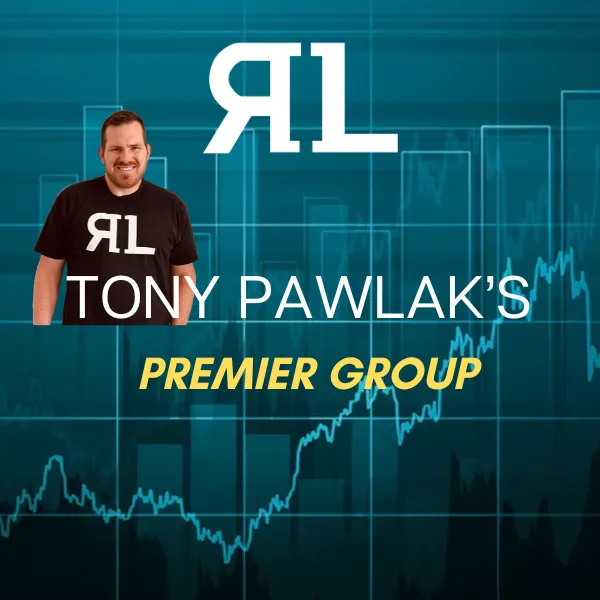
Become a Full-Time Trader in 2025 with Tony Pawlak's
Elite 10-Month Premier Coaching Program !
Registration Only Opened Once a Year!
This isn’t just another program —
it’s a proven pathway to success. Over the years, Tony has helped countless students quit their jobs and transition into full-time trading. Through personalized coaching and hands-on training, he will guide you step by step to ensure you not only learn, but master the essential skills needed to consistently win in the markets.
AS FEATURED IN

Want to Trade LIVE with other TRADERS?

Get signed up for our immersive, high-energy, active stock trading rooms.
You'll get detailed insights on entries, exits, targets, and explanations.
We answer viewer questions in real time.
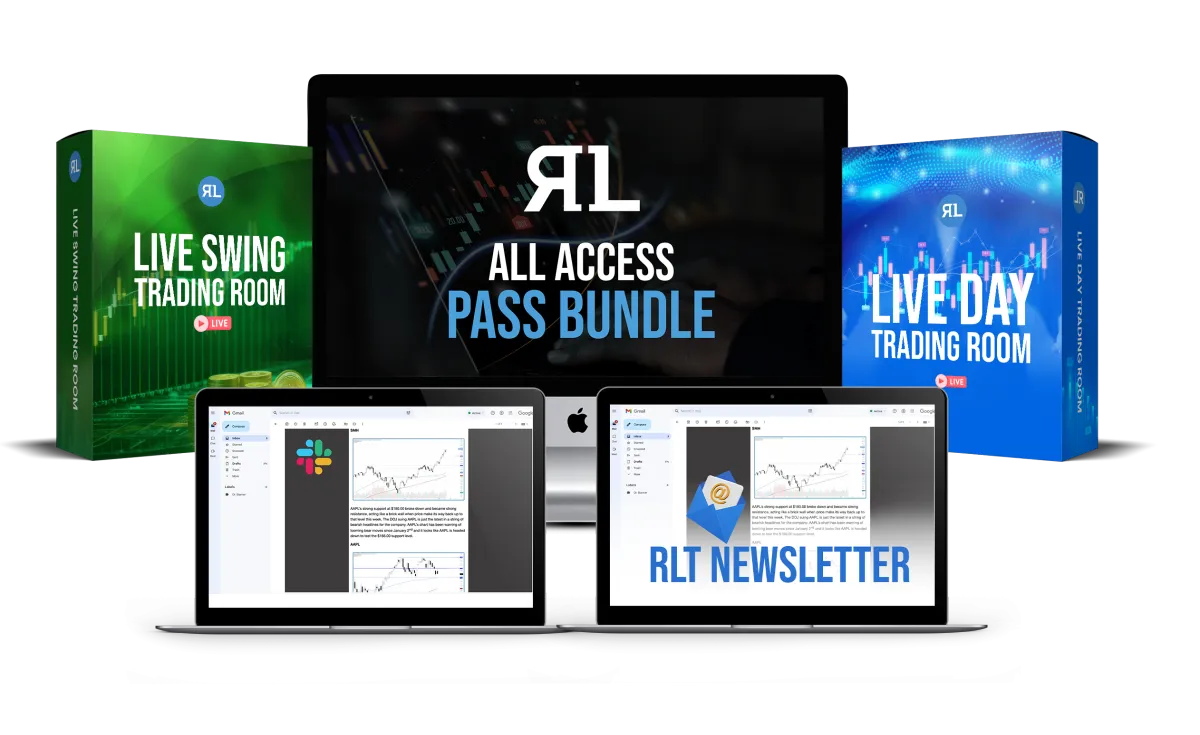
Get All Access to All Live Trading Rooms + Slack + RLT Newsletter
Just $275/Month - Best Value
Real-time trades you can follow
Exclusive Weekly Mentorships
Expert 1:1 trading support on demand
Access to a private slack group
Access to an incredible community of RLT traders to support you on your journey
Get access to live day trade & swing trading rooms
Live practice sessions/drills and strategies + get real-time feedback
Live market recaps and analysis
Weekly Q&A session to review your trades and answer your trading questions.
RLT Newsletter with trade alerts, stock picks and market analysis
Live Day Trading Room
Just $179/Month
Real-time trades you can follow
Expert 1:1 trading support on demand
Access to an incredible community of RLT traders
Get access to our live day trading room
Live practice sessions/drills and strategies + get real-time feedback
Live market recaps and analysis
Live SWING Trading Room
Just $149/Month
Real-time trades you can follow
Expert 1:1 trading support on demand
Access to an incredible community of RLT traders
Get access to our live swing trading room
Live practice sessions/drills and strategies + get real-time feedback
Live market recaps and analysis

RLT Education Programs
Mentorships

Unlock Your Trading Potential with
Funded Trading
Do you have the skills to trade, but lack the capital to make your mark in the markets?
Funded trading could be the solution you've been waiting for. With funded trading, you can trade with the backing of a funding company who will provide you with the trading capital, allowing you to focus on your strategy without the burden of risking your own capital.

Apex Trader Funding was established in
2021 with the goal of revolutionizing the trader payout model. It was founded out of dissatisfaction with existing funding companies and a desire to adopt a more customer-centric approach. As a premier trader funding company, Apex Trader Funding (ATF) outperforms other futures funding evaluation firms in terms of payouts. With a vast global community spanning over 150 countries and tens of thousands of members, Apex Trader Funding, headquartered in Austin, Texas, specializes in funding evaluations for futures markets.
Receive 100% of the first $25,000 per Account and 90% Beyond That
Two Payouts per Month
Trade Full-Sized Contracts in Evaluations or Funded Accounts
No Scaling or Failing by Going Over Contract Size
No Daily Drawdowns
Trade on Holidays
Trade Your Normal Day-to-Day Strategy or System During The News
No Total Cap on Maximum Payout
One-Step Evaluation Process
Real-Time Data Included
Simple Risk Management Rules
Trade With Multiple Accounts up to 20 max
If you’re a trader with the knowledge and skill but are held back by limited capital, Apex Trader Funding offers you the chance to access the capital you need to trade confidently.
Join the revolution in trading today with Apex Trader Funding, where your potential is funded, and your success is our priority.
FREE TRADING RESOURCES
Take FREE online courses to learn how to earn extra income while keeping your day job, Paying off debt, investing in your future, and Retiring Early
BEGINNER GUIDE TO DAY TRADING COURSE
FREE
BEGINNER GUIDE TO SWING TRADING COURSE
FREE
BEGINNER GUIDE TO INVESTING COURSE
FREE
GET TRADE ALERTS
Just $59/Month
Are you unable to find the time to build your own trading plans, do your own scans, or set up your own alerts? If so, our systems have you covered. Seize this opportunity to establish yourself as a consistent and disciplined trader and grow your trading account. Begin your journey today by subscribing to the RLT Newsletter.
MONEY MAKING BLOGS

Market Milestones: Bitcoin Breather
There are some signs that we’re nearing a correction. Sure, I’ve said this before—but this time I mean it. Ever since the May 12th gap, I’ve actually been pretty bullish, and the market has rewarded that view. But we’re once again seeing signs of exhaustion that are getting harder to ignore.
Take the QQQ, for example. It’s formed a rising wedge pattern over the past month, slowly grinding higher on declining volume, while also showing bearish RSI divergence. Could it still melt up into new all-time highs? Absolutely. But I don’t see a realistic path where it continues much higher without a sizable dip in the next month or two.
QQQ

SPY is showing a very similar setup—another rising wedge near all-time highs, hitting my 2015 analog target of $604. Just like QQQ, it’s making new highs on weaker volume and bearish RSI divergence. I could easily see a final pop to the $616 level, a new all-time high and my 2018 analog target, before a more meaningful pullback begins. The 2018 analog fits our current price action even better than the 2015 and 2020 analogs—and it aligns nicely with my Elliott Wave count. History tends to rhyme, and these analogs have been extremely useful when paired with Elliott Wave, support/resistance levels, long-term moving averages, and other forms of technical analysis that we do here at RLT.
SPY

Another yellow flag: market breadth. As SPY inches toward its all-time highs (less than 2% away as of Thursday), only about 50% of the stocks in the S&P 500 are above their 200-day SMA. That’s weak breadth for this bull run, and divergences are continuing to stack up. You can also see this in the equal-weighted S&P 500 (RSP), which is still 5% away from its all-time highs and hasn’t even broken its May high—unlike SPY. A lot of the names carrying this rally are extended and looking like they need a breather.
Percent of S&P 500 Stocks Above 200-Day SMA

Speaking of breathers—Bitcoin is pulling back as I write this. It’s now down three days in a row after retracing 88% of the May pullback—the exact level I highlighted last week in our Slack channel where we wanted to see it reject.
The key to the early June move up off the low is that it always stayed a 3-wave move and never developed into a 5-wave impulse. That signaled to me it was most likely a B wave—meaning a C wave to new lows is incoming. This vertical drop, ironically enough, keeps our super bullish wave count alive and suggests we may get to buy more in the $90,000s once again.
We are currently pulling back sharply because of the Israel-Iran conflict news, but the drop had already begun before that broke, signaling broader risk-off sentiment.
My BTC buy zone has remained unchanged since May 23: I’m looking to add between $98,000 and $92,000, with a hard line at $88,000 for major support. For IBIT, that translates to buying in the $56–$52 range, with a $50 line in the sand. Even in a less bullish scenario, I see a move back to around $123,456.78—about 30% upside from that zone. In the most bullish case? There’s potential for a 100% move from here… but shhhhhh, let’s not say that part too loud.
BTCUSD

If you’re thinking about YOLOing into it at these levels, just first ask yourself: why weren’t you buying at $85,000–$75,000 a few months ago? And why are you buying now? My guess is FOMO is playing a large role in that decision—and FOMO is a no-no when it comes to trading and investing.
Sure, the long-term potential is massive—I do think BTC will one day be seven-figures per coin—but that doesn't mean risk is low right here. If you can’t (or don’t want to) stomach a potential 50% - 70% drawdown—less than a typical crypto winter—be sure to manage your risk accordingly. This is a wonderful but very volatile asset. Respect the volatility, and plan your trades.
In conclusion, it’s impossible to predict exactly how the Israel-Iran conflict will unfold or how deeply it will impact global markets—but history is clear: wars are often moments where sharp sell-offs create some of the best buying opportunities. As unsettling as it sounds, major geopolitical shocks tend to shake out weak hands and reset risk. Even if this conflict doesn’t spark a larger correction, something else likely will in the next few weeks. And when it does, we’ll be ready—prepared to step in at better levels with far more attractive risk-reward across the board.

Market Milestones: Bitcoin Breather
There are some signs that we’re nearing a correction. Sure, I’ve said this before—but this time I mean it. Ever since the May 12th gap, I’ve actually been pretty bullish, and the market has rewarded that view. But we’re once again seeing signs of exhaustion that are getting harder to ignore.
Take the QQQ, for example. It’s formed a rising wedge pattern over the past month, slowly grinding higher on declining volume, while also showing bearish RSI divergence. Could it still melt up into new all-time highs? Absolutely. But I don’t see a realistic path where it continues much higher without a sizable dip in the next month or two.
QQQ
SPY is showing a very similar setup—another rising wedge near all-time highs, hitting my 2015 analog target of $604. Just like QQQ, it’s making new highs on weaker volume and bearish RSI divergence. I could easily see a final pop to the $616 level, a new all-time high and my 2018 analog target, before a more meaningful pullback begins. The 2018 analog fits our current price action even better than the 2015 and 2020 analogs—and it aligns nicely with my Elliott Wave count. History tends to rhyme, and these analogs have been extremely useful when paired with Elliott Wave, support/resistance levels, long-term moving averages, and other forms of technical analysis that we do here at RLT.
SPY
Another yellow flag: market breadth. As SPY inches toward its all-time highs (less than 2% away as of Thursday), only about 50% of the stocks in the S&P 500 are above their 200-day SMA. That’s weak breadth for this bull run, and divergences are continuing to stack up. You can also see this in the equal-weighted S&P 500 (RSP), which is still 5% away from its all-time highs and hasn’t even broken its May high—unlike SPY. A lot of the names carrying this rally are extended and looking like they need a breather.
Percent of S&P 500 Stocks Above 200-Day SMA
Speaking of breathers—Bitcoin is pulling back as I write this. It’s now down three days in a row after retracing 88% of the May pullback—the exact level I highlighted last week in our Slack channel where we wanted to see it reject.
The key to the early June move up off the low is that it always stayed a 3-wave move and never developed into a 5-wave impulse. That signaled to me it was most likely a B wave—meaning a C wave to new lows is incoming. This vertical drop, ironically enough, keeps our super bullish wave count alive and suggests we may get to buy more in the $90,000s once again.
We are currently pulling back sharply because of the Israel-Iran conflict news, but the drop had already begun before that broke, signaling broader risk-off sentiment.
My BTC buy zone has remained unchanged since May 23: I’m looking to add between $98,000 and $92,000, with a hard line at $88,000 for major support. For IBIT, that translates to buying in the $56–$52 range, with a $50 line in the sand. Even in a less bullish scenario, I see a move back to around $123,456.78—about 30% upside from that zone. In the most bullish case? There’s potential for a 100% move from here… but shhhhhh, let’s not say that part too loud.
BTCUSD
If you’re thinking about YOLOing into it at these levels, just first ask yourself: why weren’t you buying at $85,000–$75,000 a few months ago? And why are you buying now? My guess is FOMO is playing a large role in that decision—and FOMO is a no-no when it comes to trading and investing.
Sure, the long-term potential is massive—I do think BTC will one day be seven-figures per coin—but that doesn't mean risk is low right here. If you can’t (or don’t want to) stomach a potential 50% - 70% drawdown—less than a typical crypto winter—be sure to manage your risk accordingly. This is a wonderful but very volatile asset. Respect the volatility, and plan your trades.
In conclusion, it’s impossible to predict exactly how the Israel-Iran conflict will unfold or how deeply it will impact global markets—but history is clear: wars are often moments where sharp sell-offs create some of the best buying opportunities. As unsettling as it sounds, major geopolitical shocks tend to shake out weak hands and reset risk. Even if this conflict doesn’t spark a larger correction, something else likely will in the next few weeks. And when it does, we’ll be ready—prepared to step in at better levels with far more attractive risk-reward across the board.
ABOUT REAL LIFE TRADING
We are a stock trading education company. Our goal is to teach and empower people to create generational wealth to enrich their lives and communities.
ONLINE TRAINING LINKS
